U.S. Military Spending Has Increased 10x in the Past 50 Years
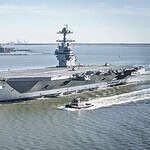
Over the past 50 years, U.S. military spending has grown dramatically, expanding from Cold War-era budgets to the massive defense spending seen today. Rising global tensions, rapid technological advances, and shifting national priorities have all contributed to the steady increase. Today, the U.S. military operates one of the most sophisticated and expensive defense systems in the world, supported by advanced aircraft, naval fleets, missile systems, and global deployments. Looking at how military spending has changed over time provides important insight into America’s strategic priorities and its role in global security.
To track how spending has evolved, History Computer analyzed annual U.S. military expenditure data from the Stockholm International Peace Research Institute (SIPRI) Military Expenditure Database, covering the years 1973 through 2022. Figures are presented in current U.S. dollars. We also calculated the year-over-year percentage change in military spending as well as defense spending as a share of U.S. gross domestic product (GDP).
Why Are We Covering This?
It’s important to explore the dramatic rise in U.S. military spending because it directly affects everything from national priorities, global influence, and the everyday lives of American citizens. Understanding where trillions of dollars go and how this massive sum contributes to our defense helps the public feel secure. Citizens can evaluate whether current defense spending aligns with today’s security challenges or seems unnecessary and outdated. Increased military spending also influences federal budgets, which dictates what is available for healthcare, education, infrastructure, and social programs. By examining how and why defense costs have grown so much, we can better understand the trade-offs associated with the most expensive military in the world.
Here is a look at U.S. military expenditures over the last 50 years:
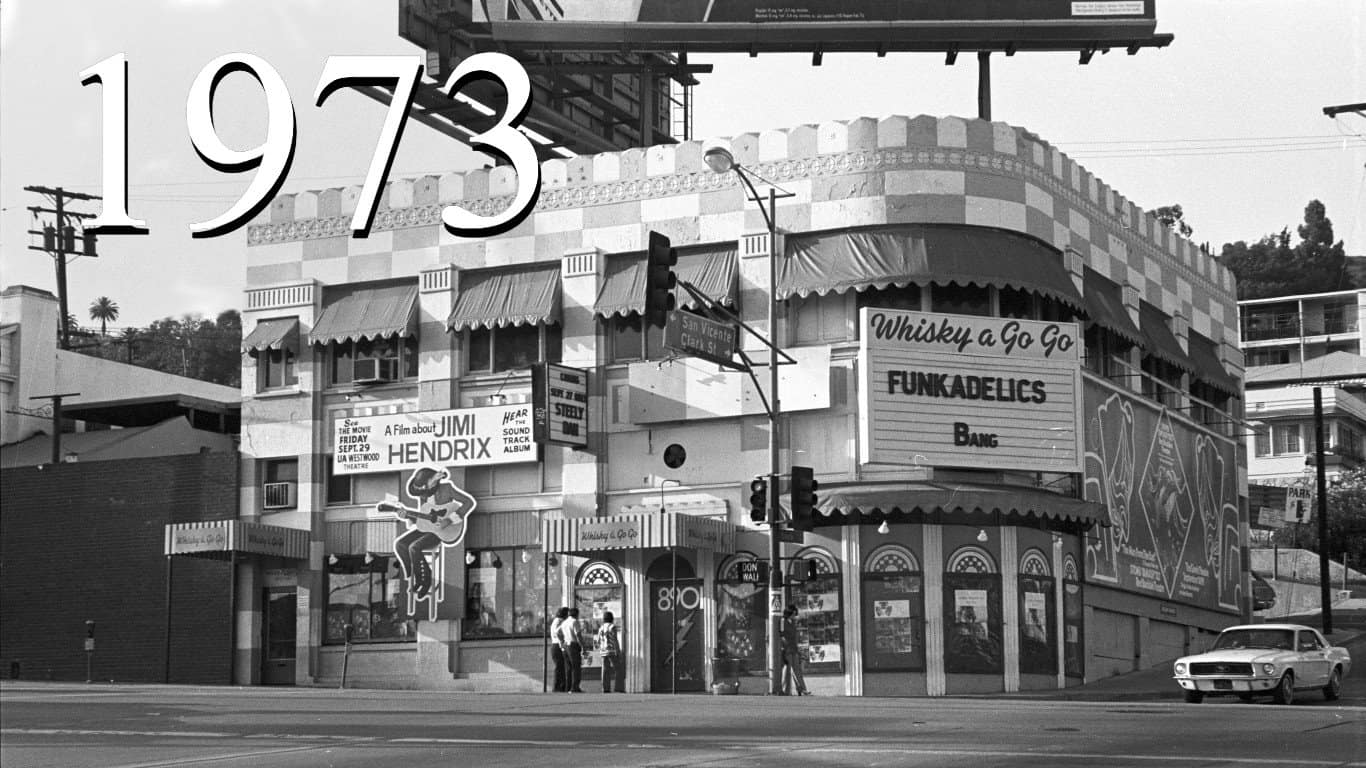
1973: $ 81.47 billion
Percent change in spending: 0.94% – 39. largest year-over-year increase
Spending as a percent of GDP: 5.89%
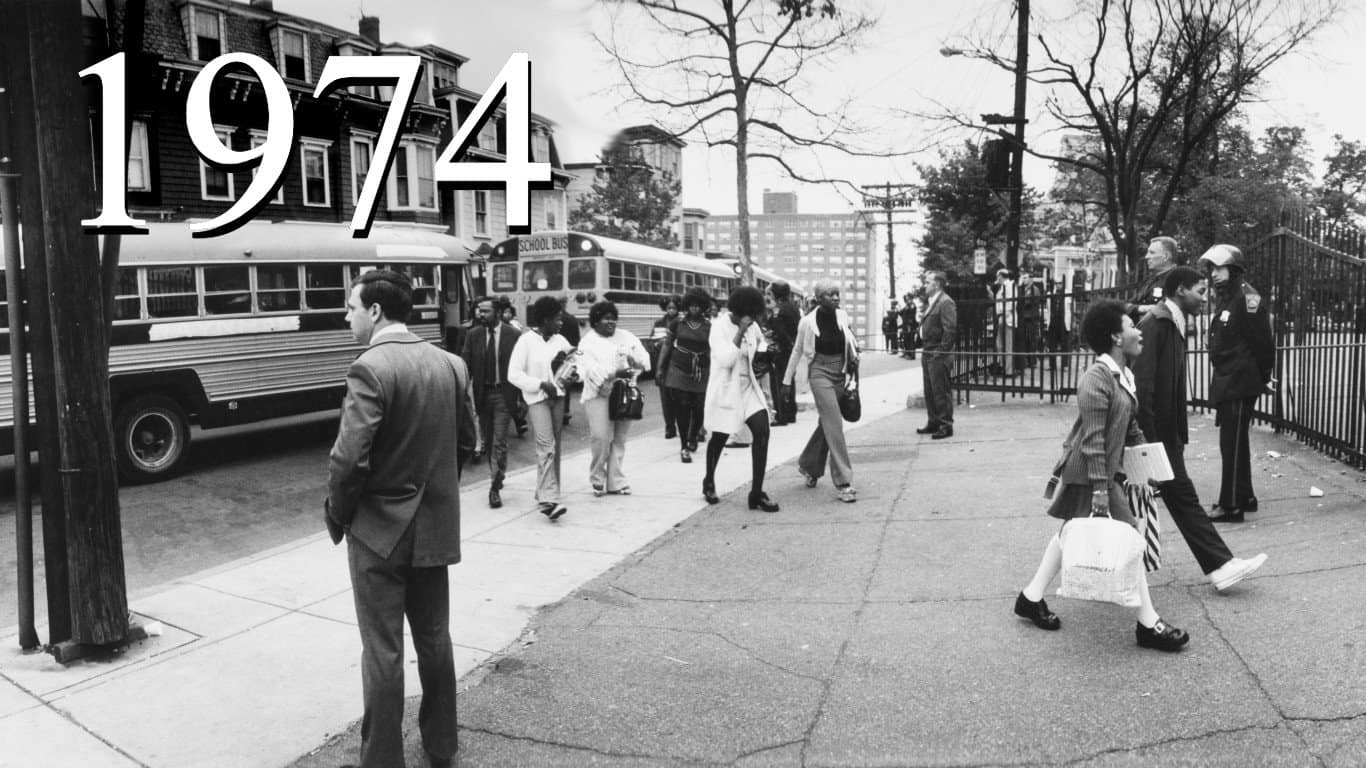
1974: $ 89.28 billion
Percent change in spending: 9.59% – 12. largest year-over-year increase
Spending as a percent of GDP: 5.95%
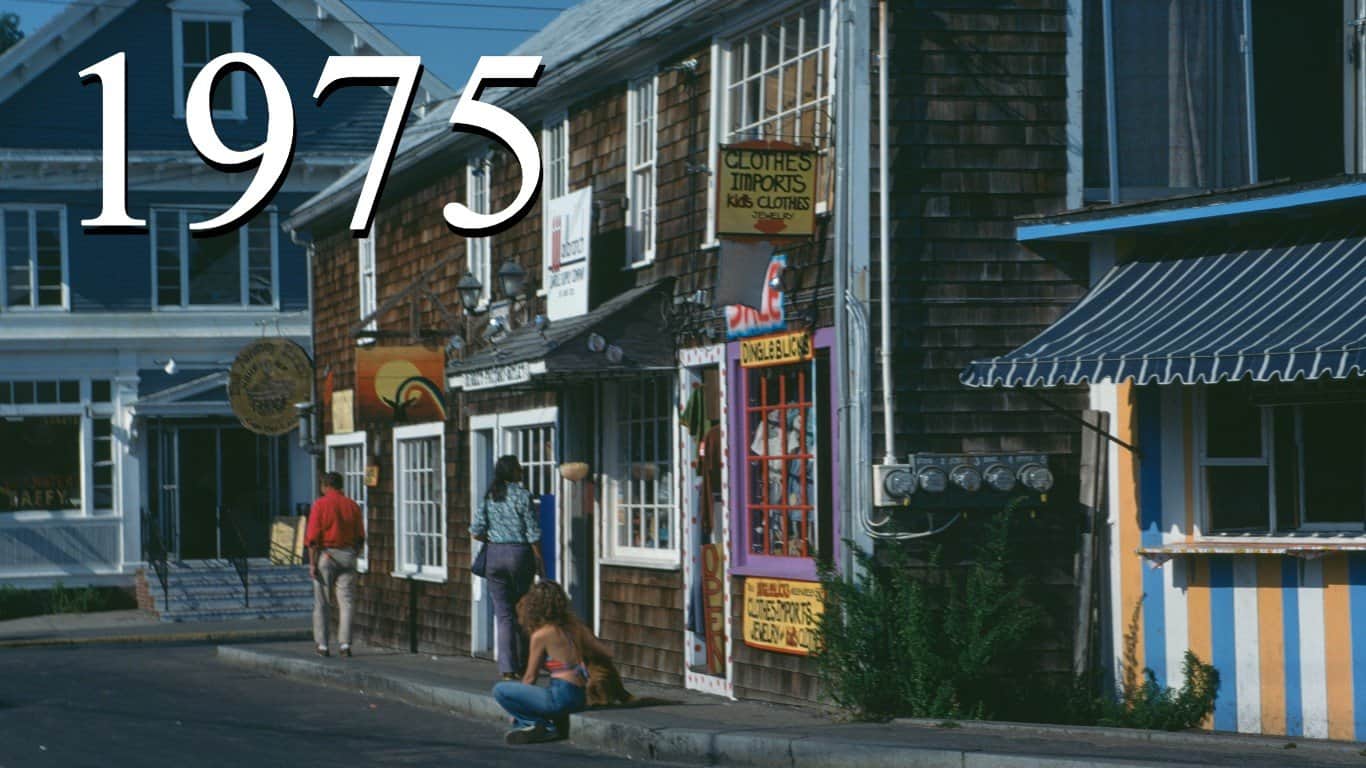
1975: $ 92.08 billion
Percent change in spending: 3.14% – 29. largest year-over-year increase
Spending as a percent of GDP: 5.62%
1976: $ 94.72 billion
Percent change in spending: 2.86% – 31. largest year-over-year increase
Spending as a percent of GDP: 5.19%
1977: $ 104.67 billion
Percent change in spending: 10.51% – 10. largest year-over-year increase
Spending as a percent of GDP: 5.16%
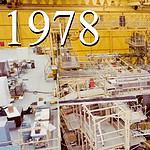
1978: $ 113.38 billion
Percent change in spending: 8.33% – 16. largest year-over-year increase
Spending as a percent of GDP: 4.94%
1979: $ 126.88 billion
Percent change in spending: 11.90% – 7. largest year-over-year increase
Spending as a percent of GDP: 4.95%
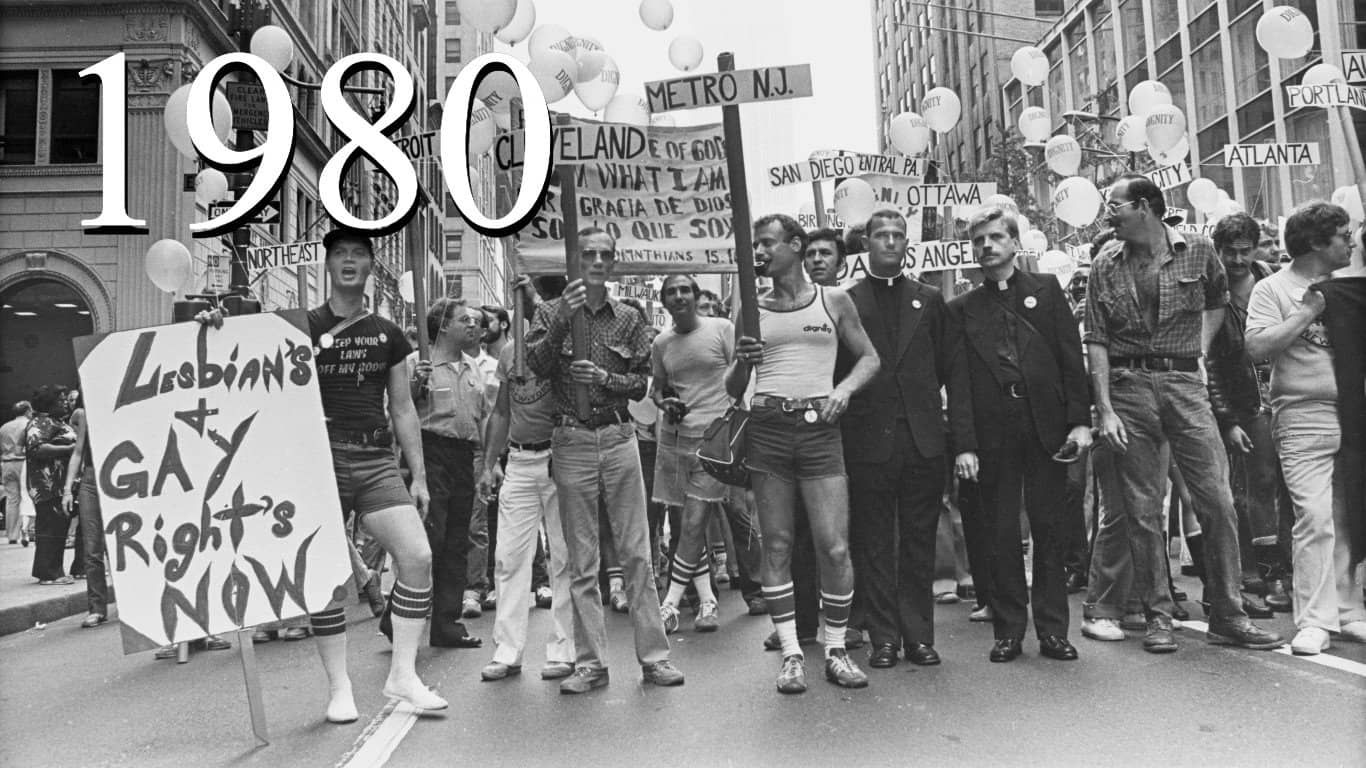
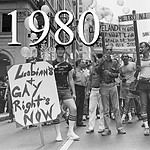
1980: $ 143.69 billion
Percent change in spending: 13.25% – 5. largest year-over-year increase
Spending as a percent of GDP: 5.15%
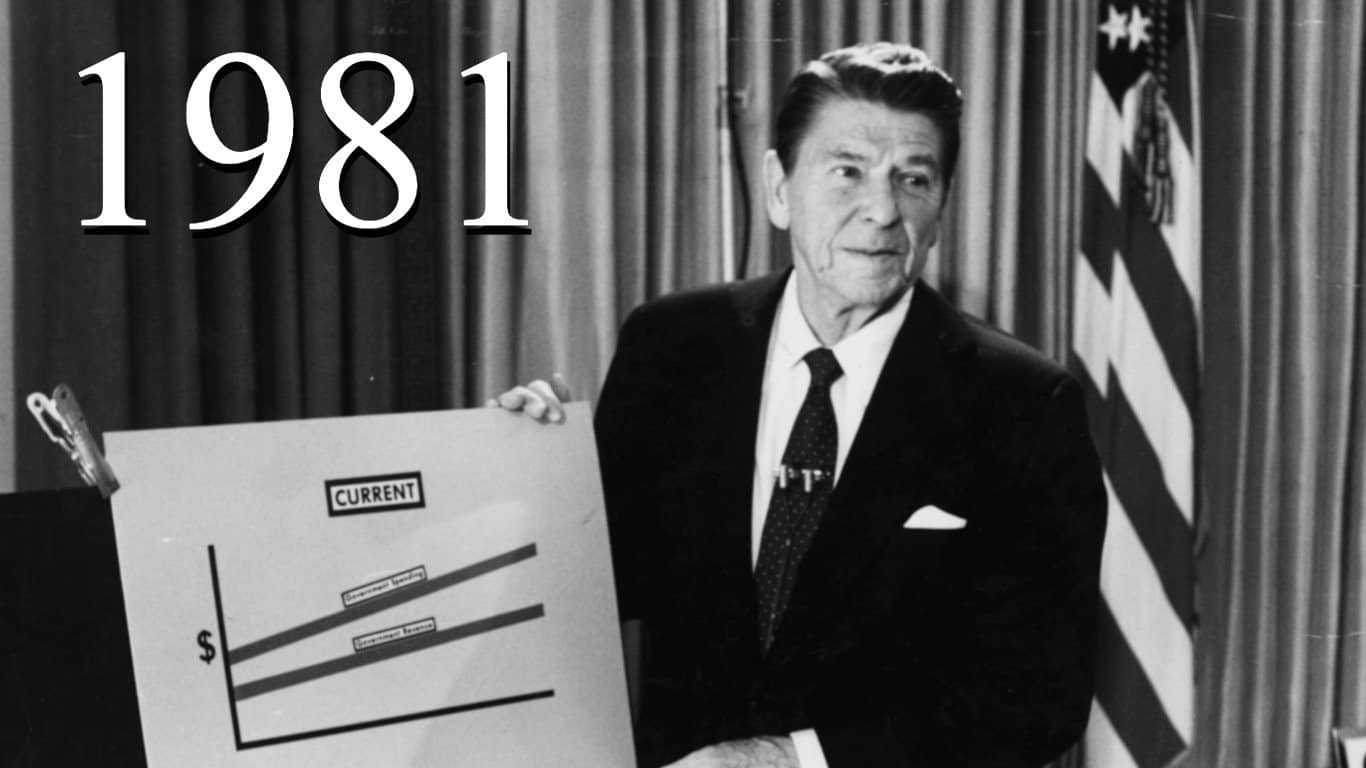
1981: $ 176.56 billion
Percent change in spending: 22.88% – 2. largest year-over-year increase
Spending as a percent of GDP: 5.65%
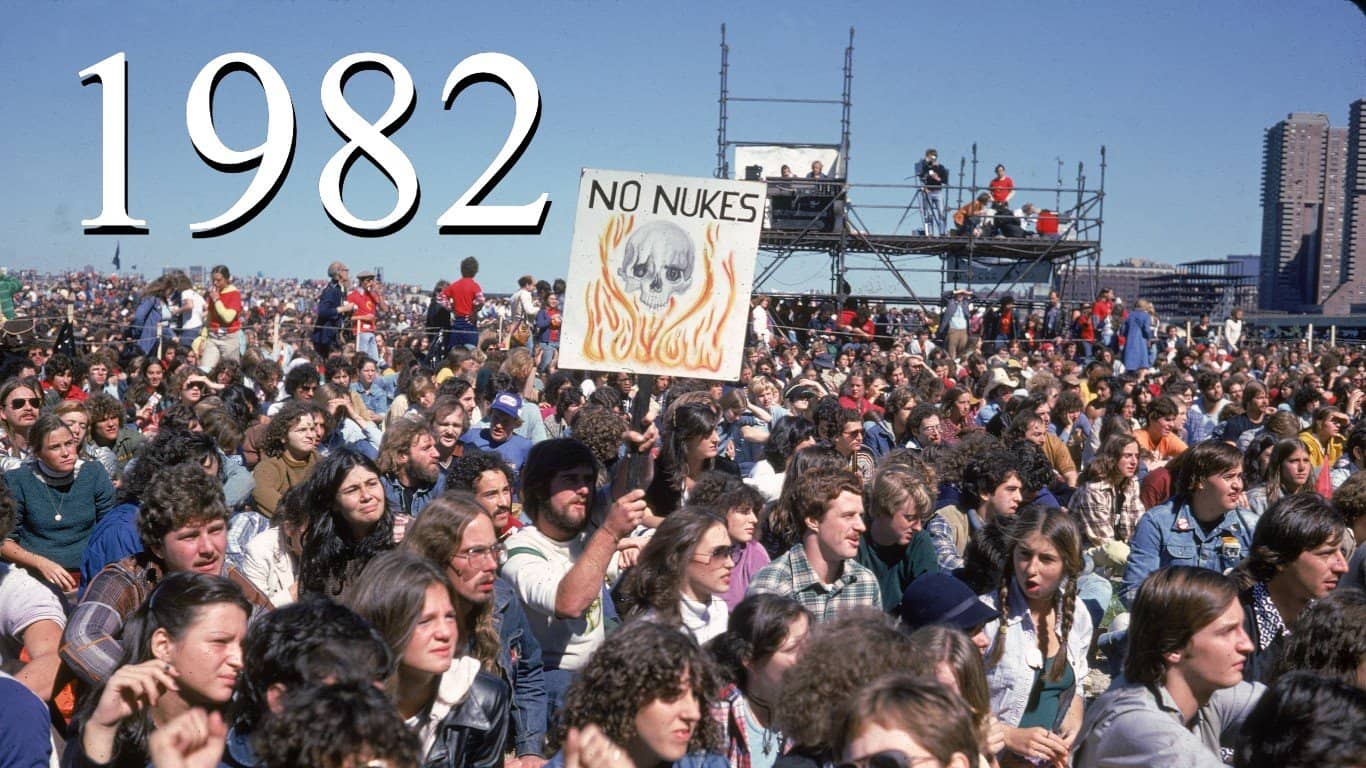
1982: $ 221.67 billion
Percent change in spending: 25.55% – 1. largest year-over-year increase
Spending as a percent of GDP: 6.81%
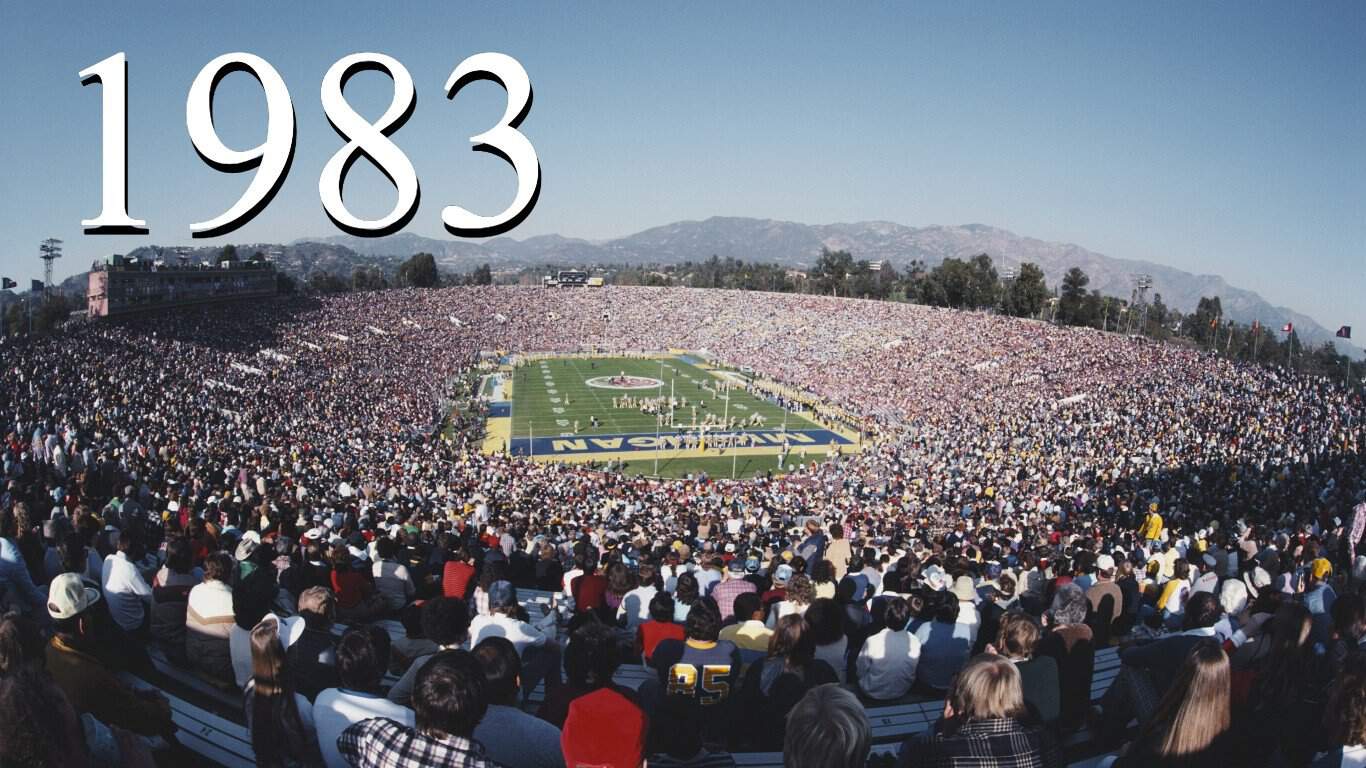
1983: $ 223.43 billion
Percent change in spending: 0.79% – 40. largest year-over-year increase
Spending as a percent of GDP: 6.32%
1984: $ 245.15 billion
Percent change in spending: 9.72% – 11. largest year-over-year increase
Spending as a percent of GDP: 6.24%
1985: $ 272.16 billion
Percent change in spending: 11.02% – 9. largest year-over-year increase
Spending as a percent of GDP: 6.45%
1986: $ 295.55 billion
Percent change in spending: 8.59% – 14. largest year-over-year increase
Spending as a percent of GDP: 6.63%
1987: $ 304.09 billion
Percent change in spending: 2.89% – 30. largest year-over-year increase
Spending as a percent of GDP: 6.42%
1988: $ 309.66 billion
Percent change in spending: 1.83% – 34. largest year-over-year increase
Spending as a percent of GDP: 6.07%
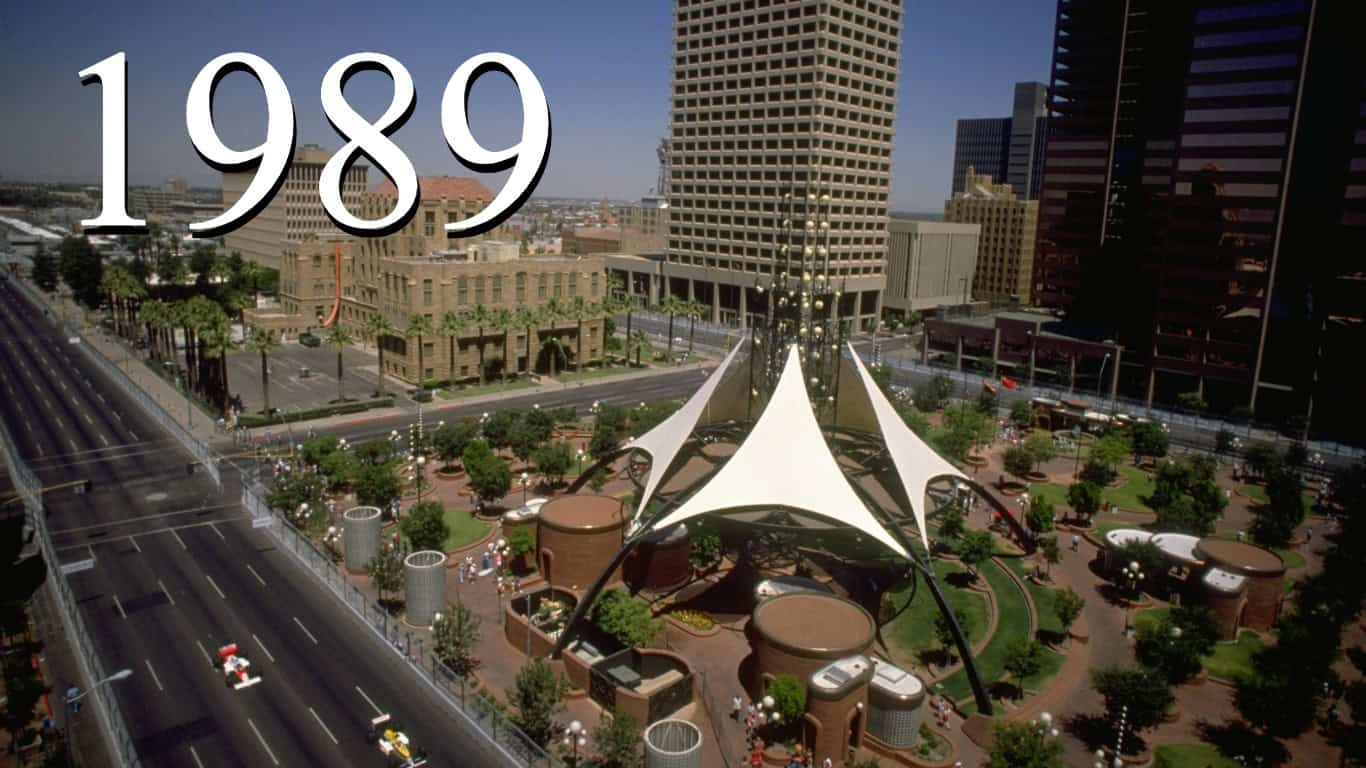
1989: $ 321.87 billion
Percent change in spending: 3.94% – 26. largest year-over-year increase
Spending as a percent of GDP: 5.87%
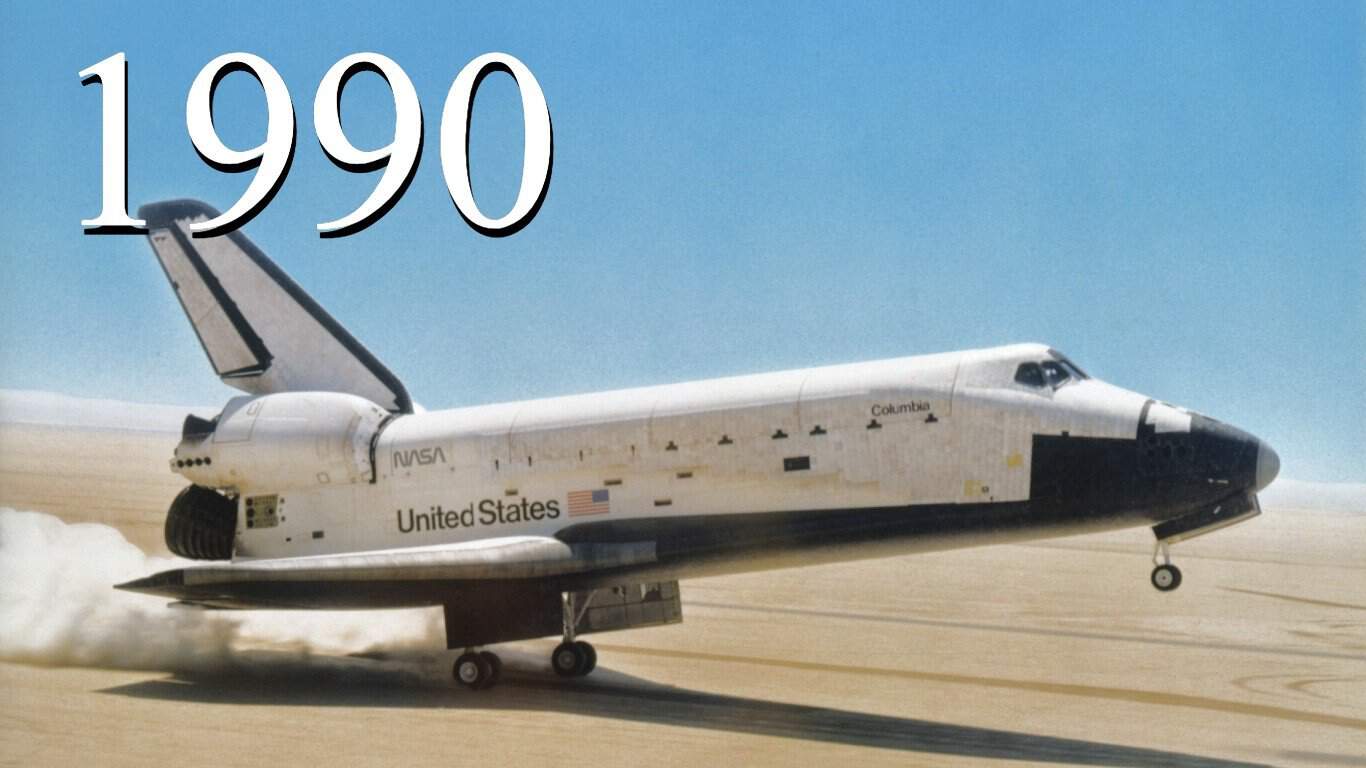
1990: $ 325.13 billion
Percent change in spending: 1.01% – 37. largest year-over-year increase
Spending as a percent of GDP: 5.61%
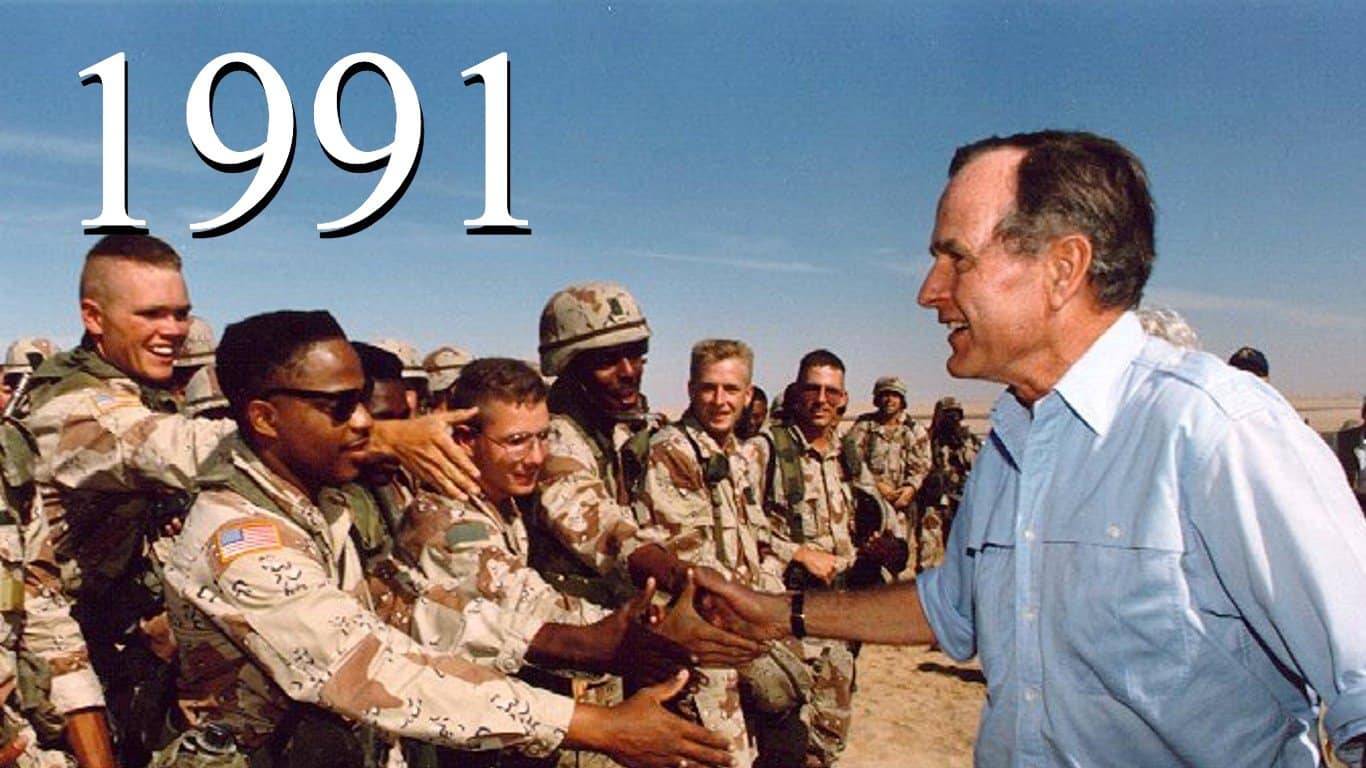
1991: $ 299.37 billion
Percent change in spending: -7.92% – 1. largest year over year decrease
Spending as a percent of GDP: 4.88%
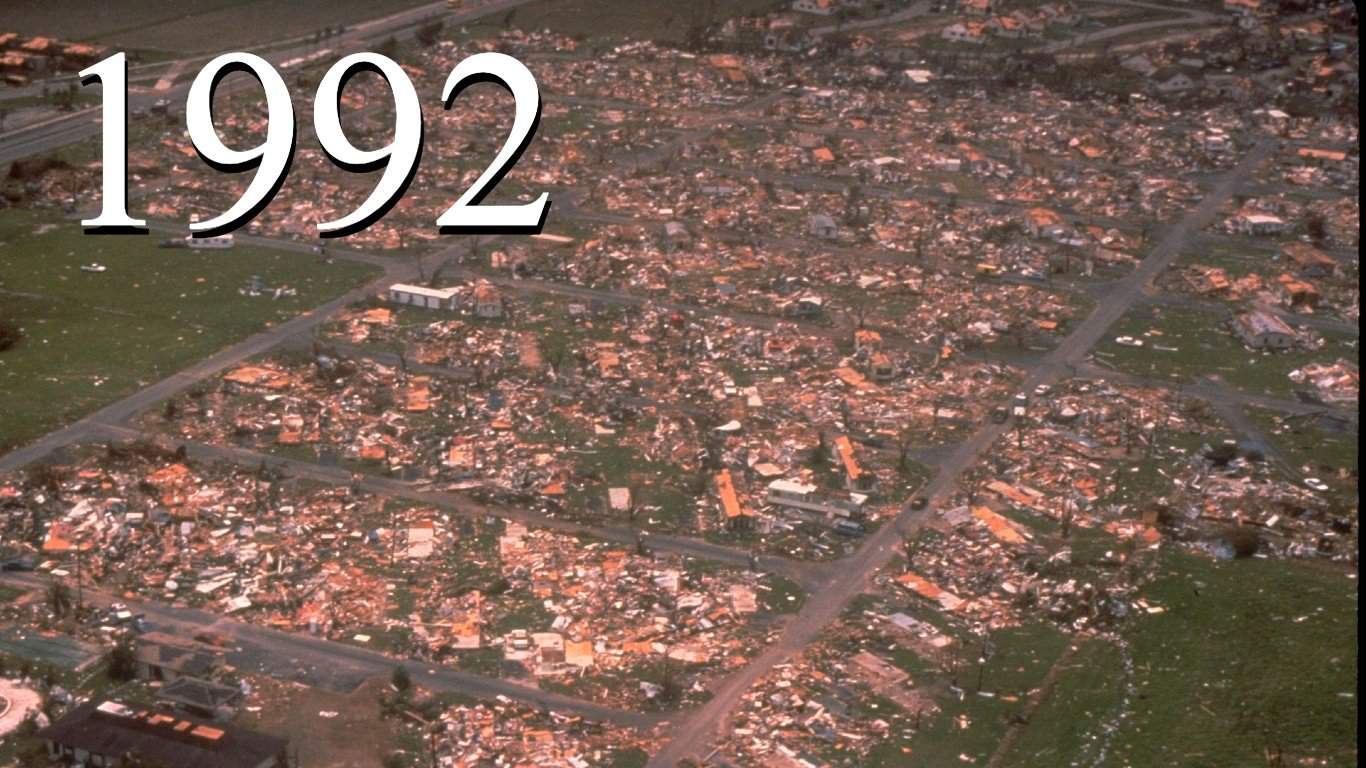
1992: $ 325.03 billion
Percent change in spending: 8.57% – 15. largest year-over-year increase
Spending as a percent of GDP: 4.97%
1993: $ 316.72 billion
Percent change in spending: -2.56% – 8. largest year over year decrease
Spending as a percent of GDP: 4.60%
1994: $ 308.08 billion
Percent change in spending: -2.73% – 6. largest year over year decrease
Spending as a percent of GDP: 4.22%
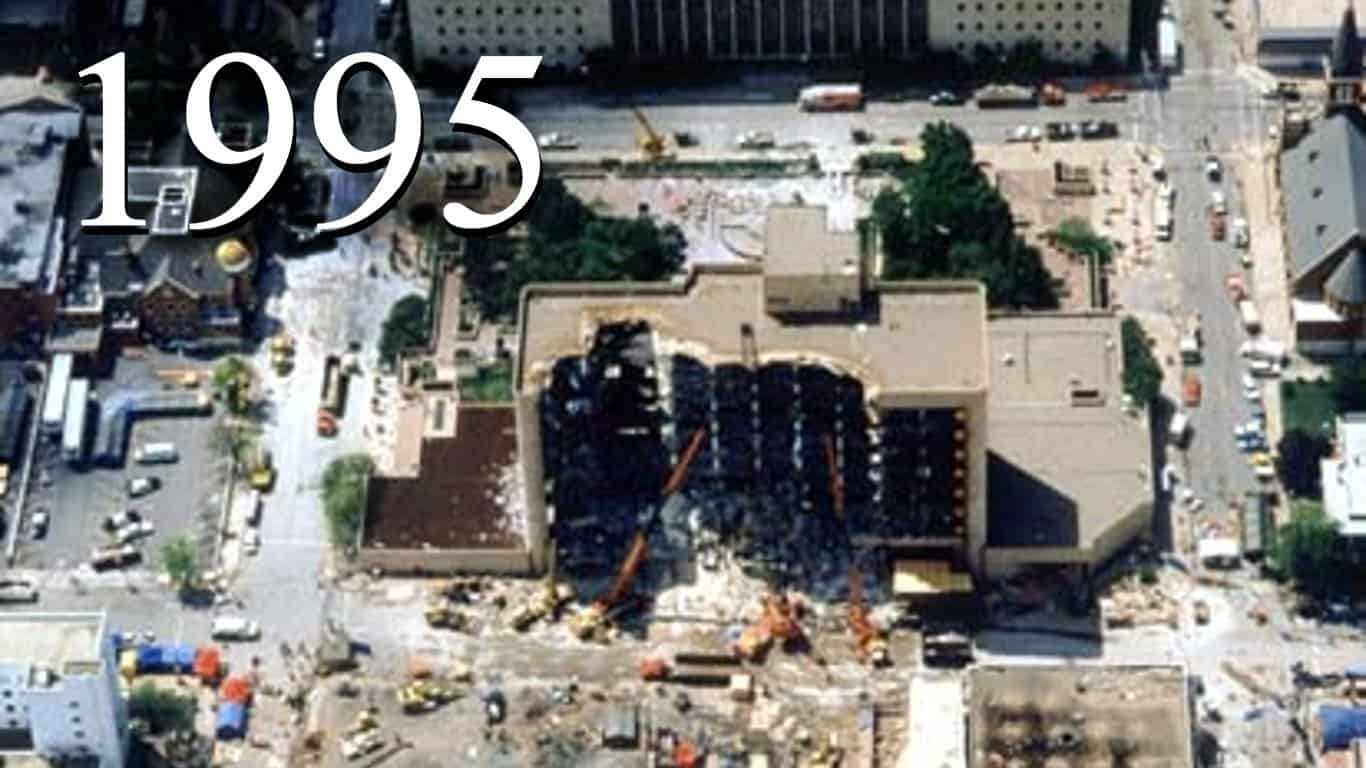
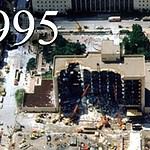
1995: $ 295.85 billion
Percent change in spending: -3.97% – 4. largest year over year decrease
Spending as a percent of GDP: 3.86%
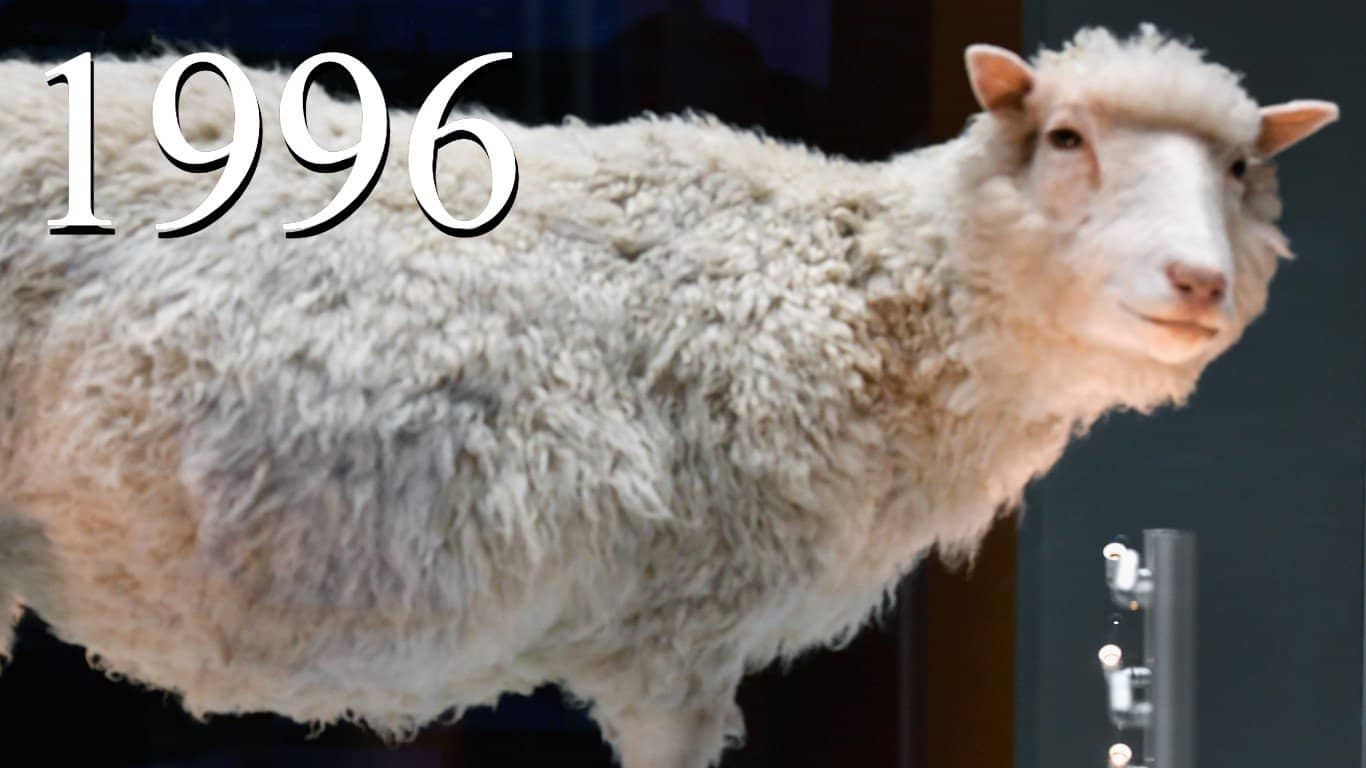
1996: $ 287.96 billion
Percent change in spending: -2.67% – 7. largest year over year decrease
Spending as a percent of GDP: 3.55%
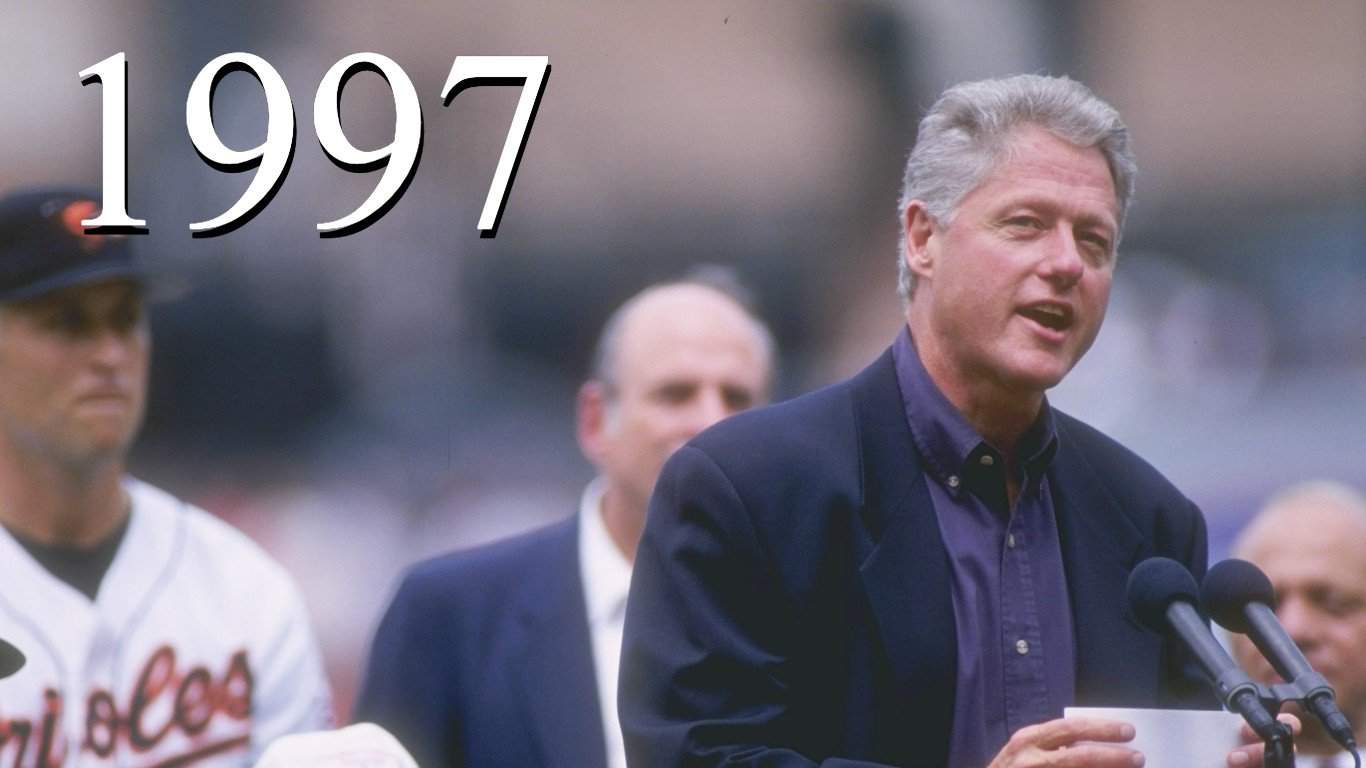
1997: $ 293.17 billion
Percent change in spending: 1.81% – 35. largest year-over-year increase
Spending as a percent of GDP: 3.41%
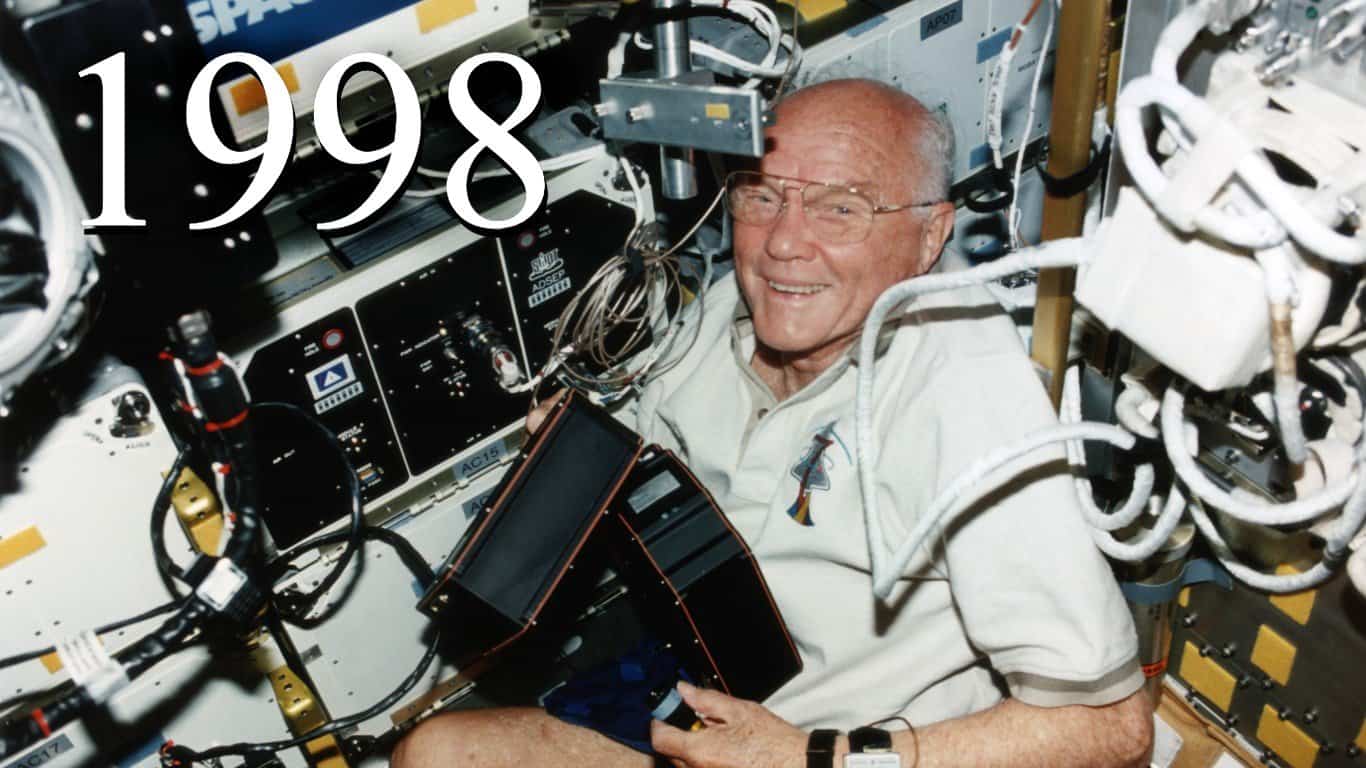
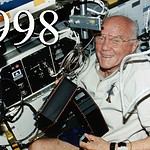
1998: $ 291.00 billion
Percent change in spending: -0.74% – 10. largest year over year decrease
Spending as a percent of GDP: 3.20%
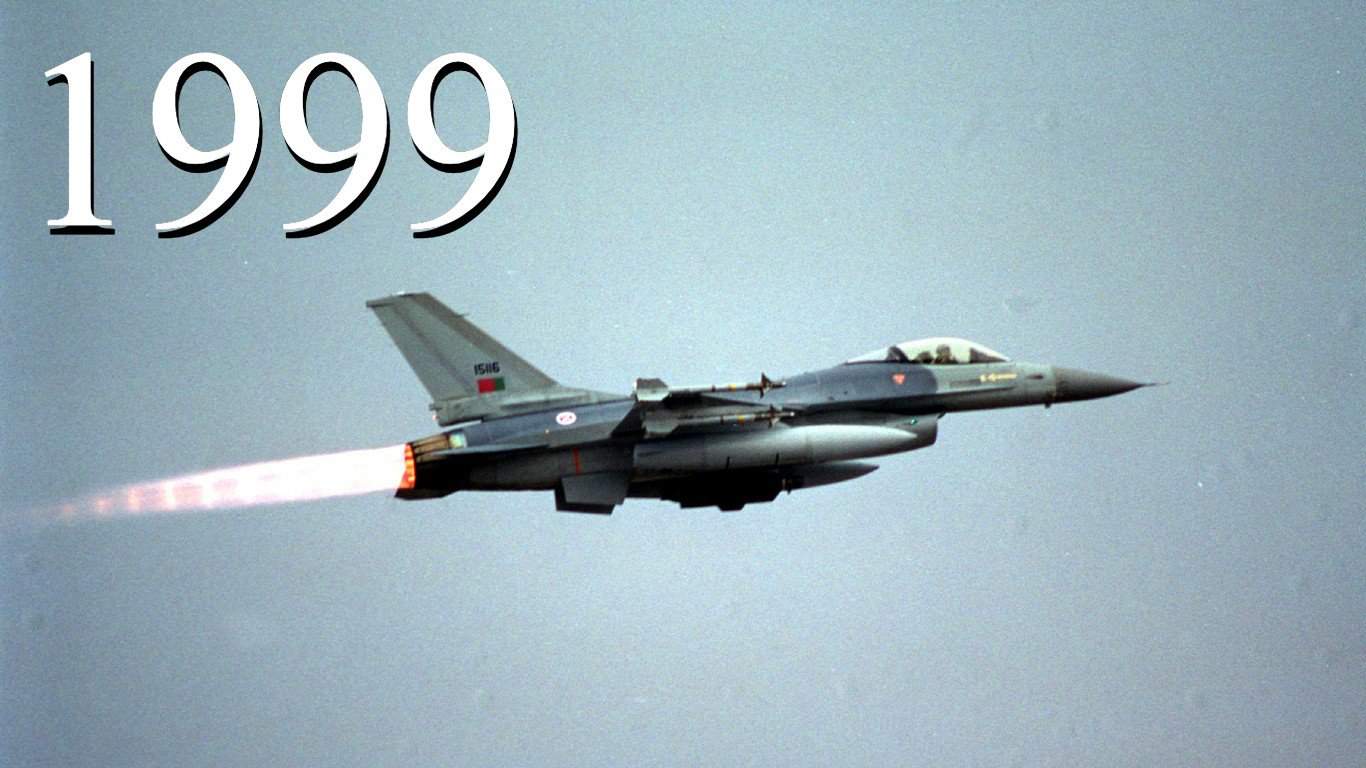
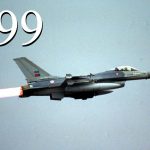
1999: $ 298.09 billion
Percent change in spending: 2.44% – 32. largest year-over-year increase
Spending as a percent of GDP: 3.09%
2000: $ 320.09 billion
Percent change in spending: 7.38% – 20. largest year-over-year increase
Spending as a percent of GDP: 3.11%
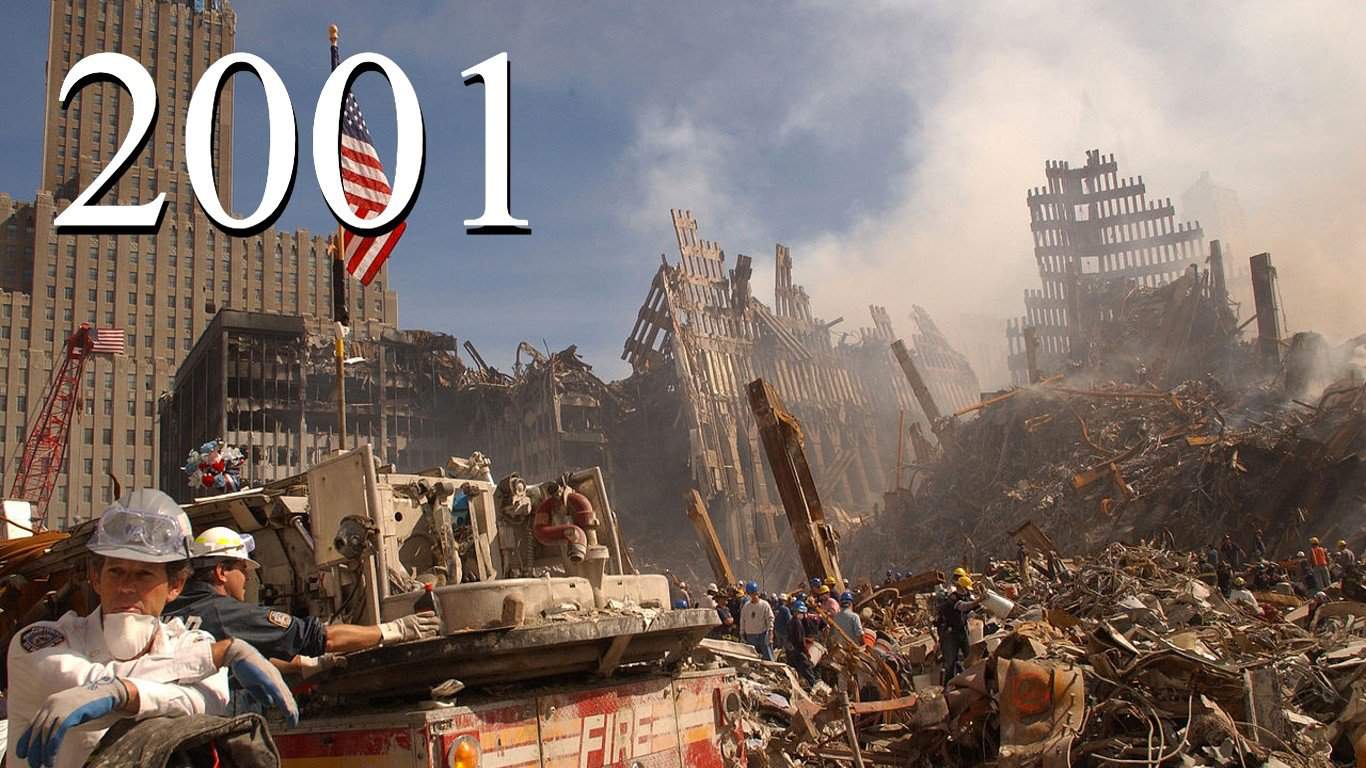
2001: $ 331.81 billion
Percent change in spending: 3.66% – 27. largest year-over-year increase
Spending as a percent of GDP: 3.12%
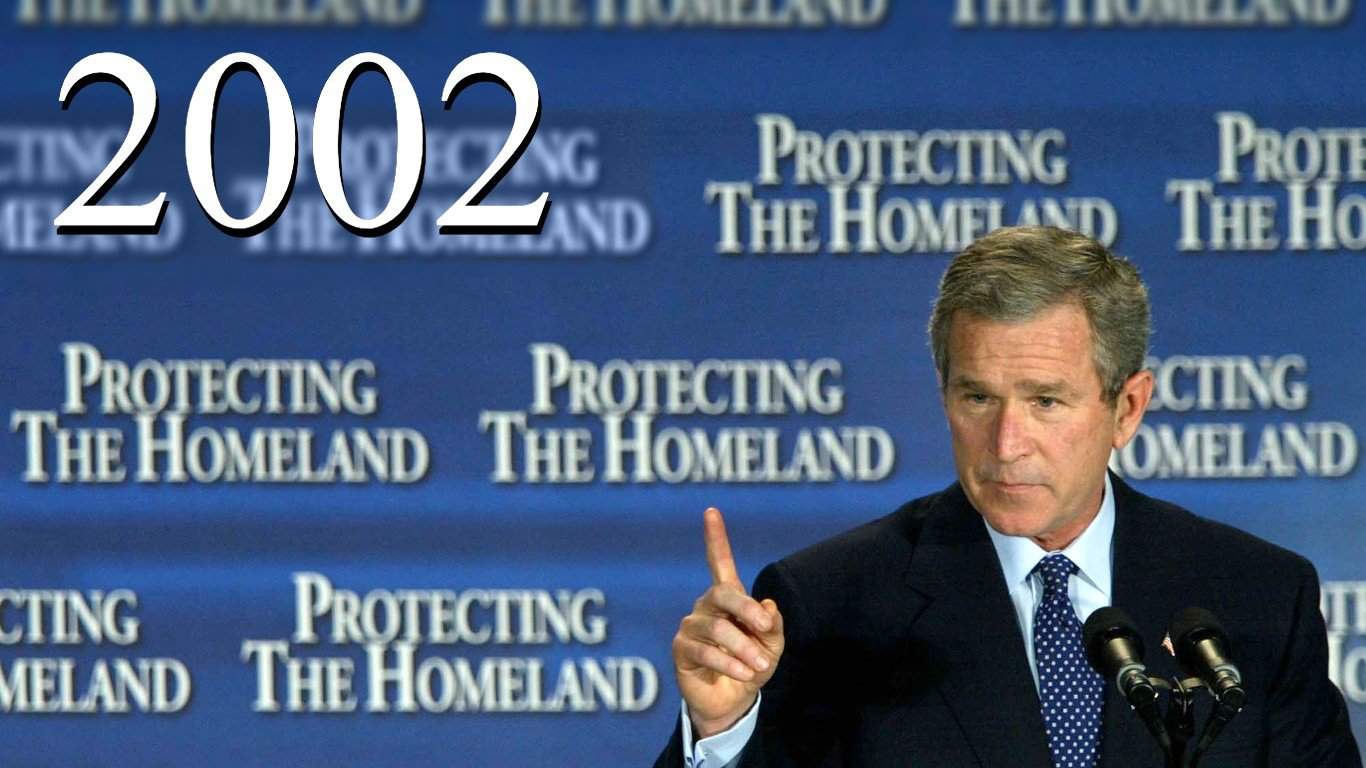
2002: $ 378.46 billion
Percent change in spending: 14.06% – 4. largest year-over-year increase
Spending as a percent of GDP: 3.45%
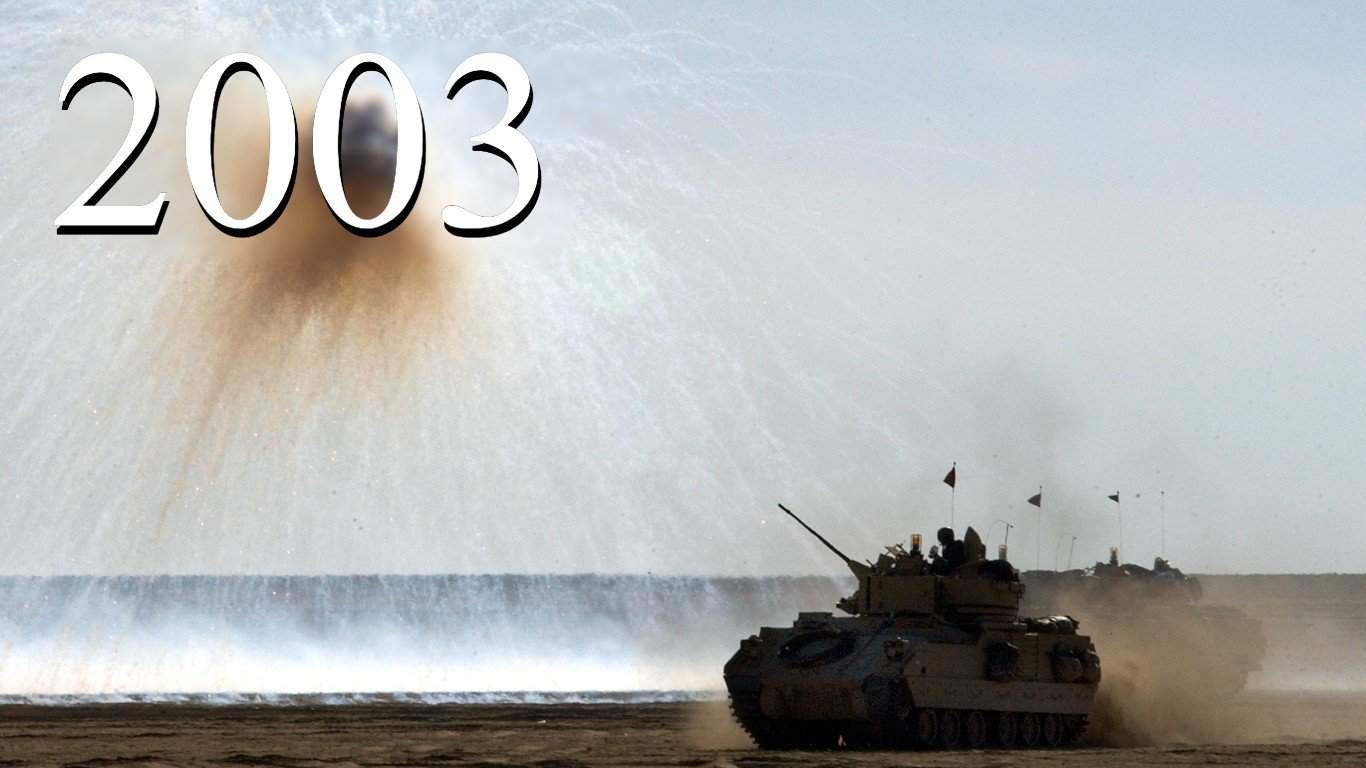
2003: $ 440.53 billion
Percent change in spending: 16.40% – 3. largest year-over-year increase
Spending as a percent of GDP: 3.83%
2004: $ 493.00 billion
Percent change in spending: 11.91% – 6. largest year-over-year increase
Spending as a percent of GDP: 4.02%
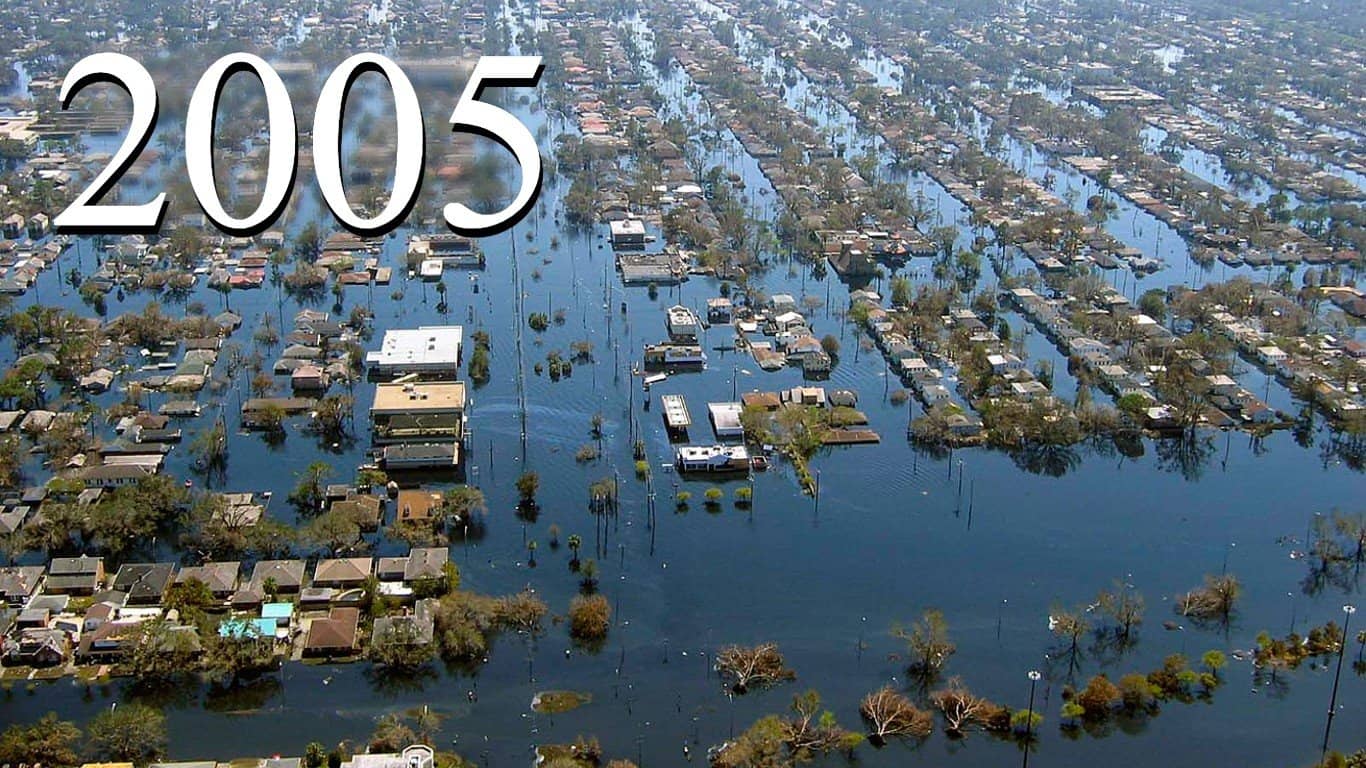
2005: $ 533.20 billion
Percent change in spending: 8.15% – 17. largest year-over-year increase
Spending as a percent of GDP: 4.09%
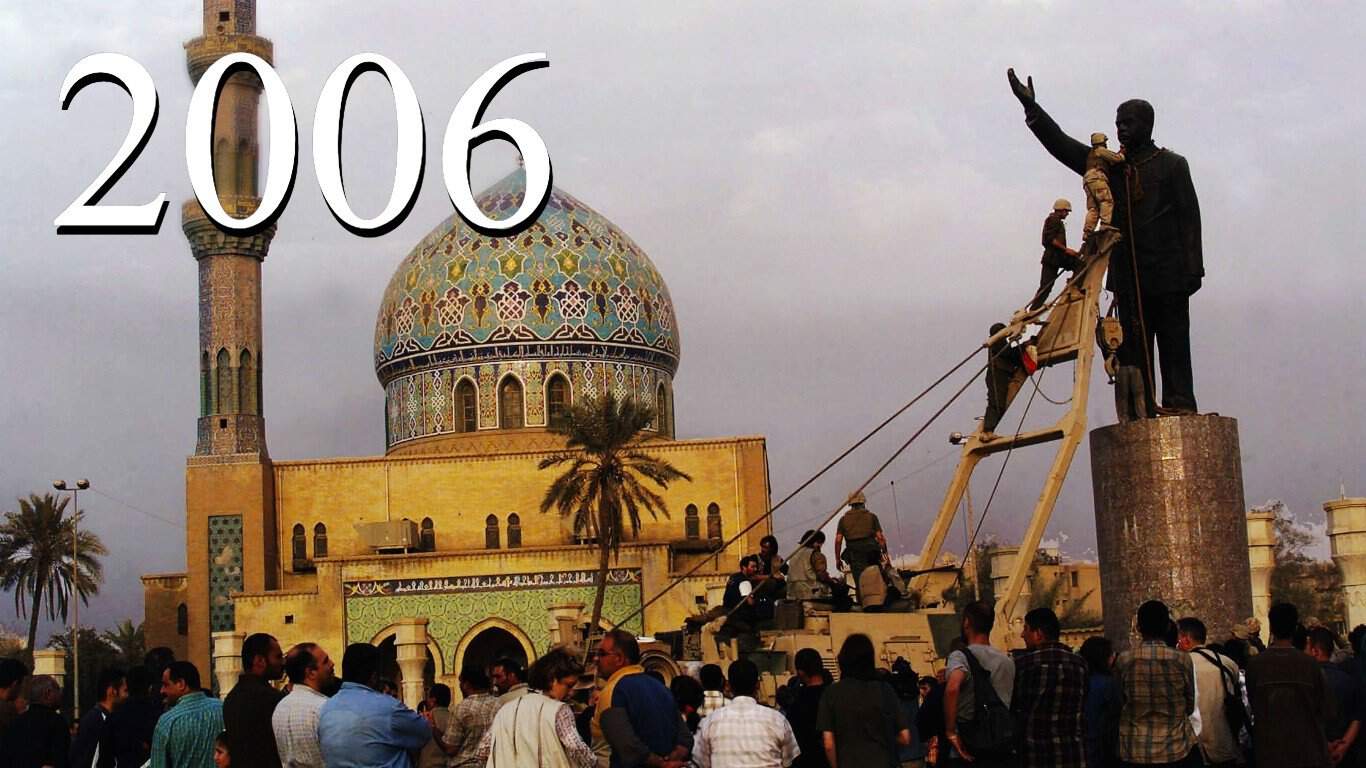
2006: $ 558.34 billion
Percent change in spending: 4.71% – 24. largest year-over-year increase
Spending as a percent of GDP: 4.04%
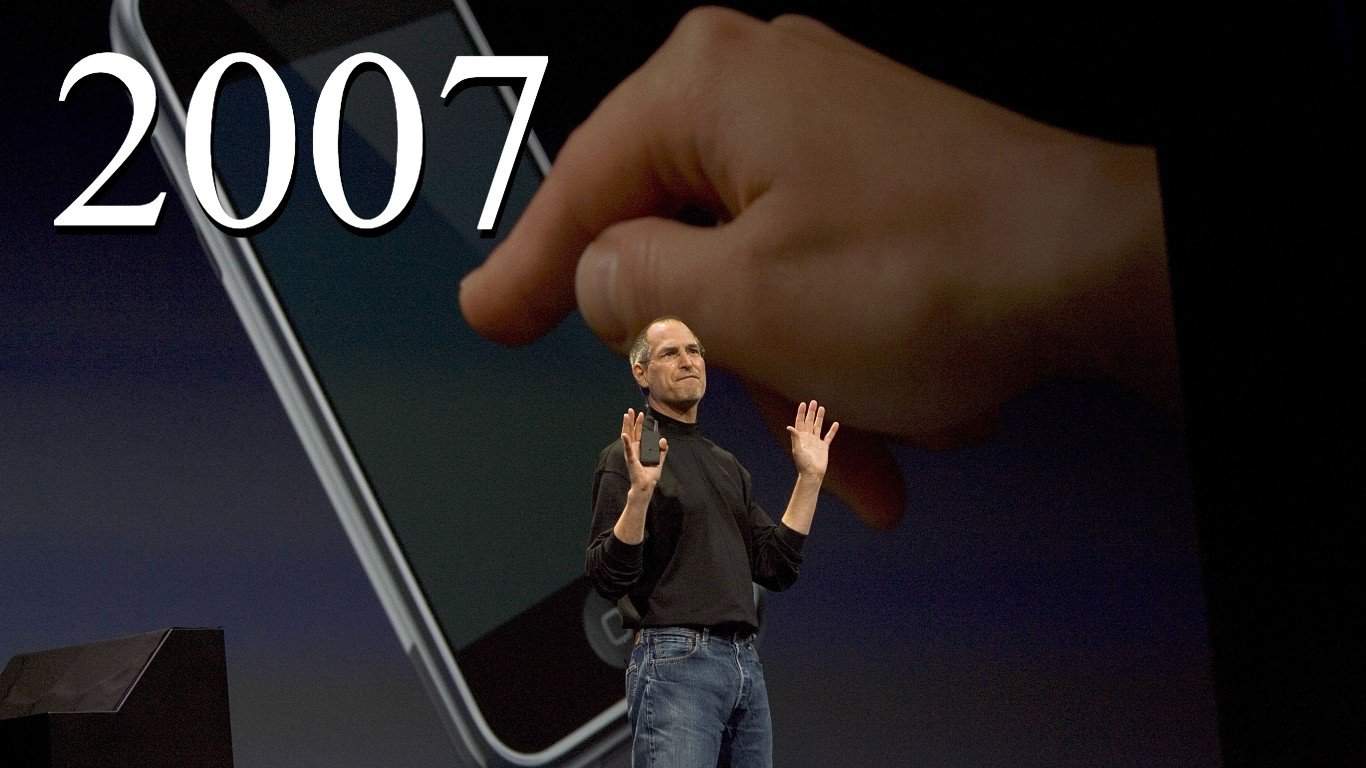
2007: $ 589.59 billion
Percent change in spending: 5.60% – 22. largest year-over-year increase
Spending as a percent of GDP: 4.07%
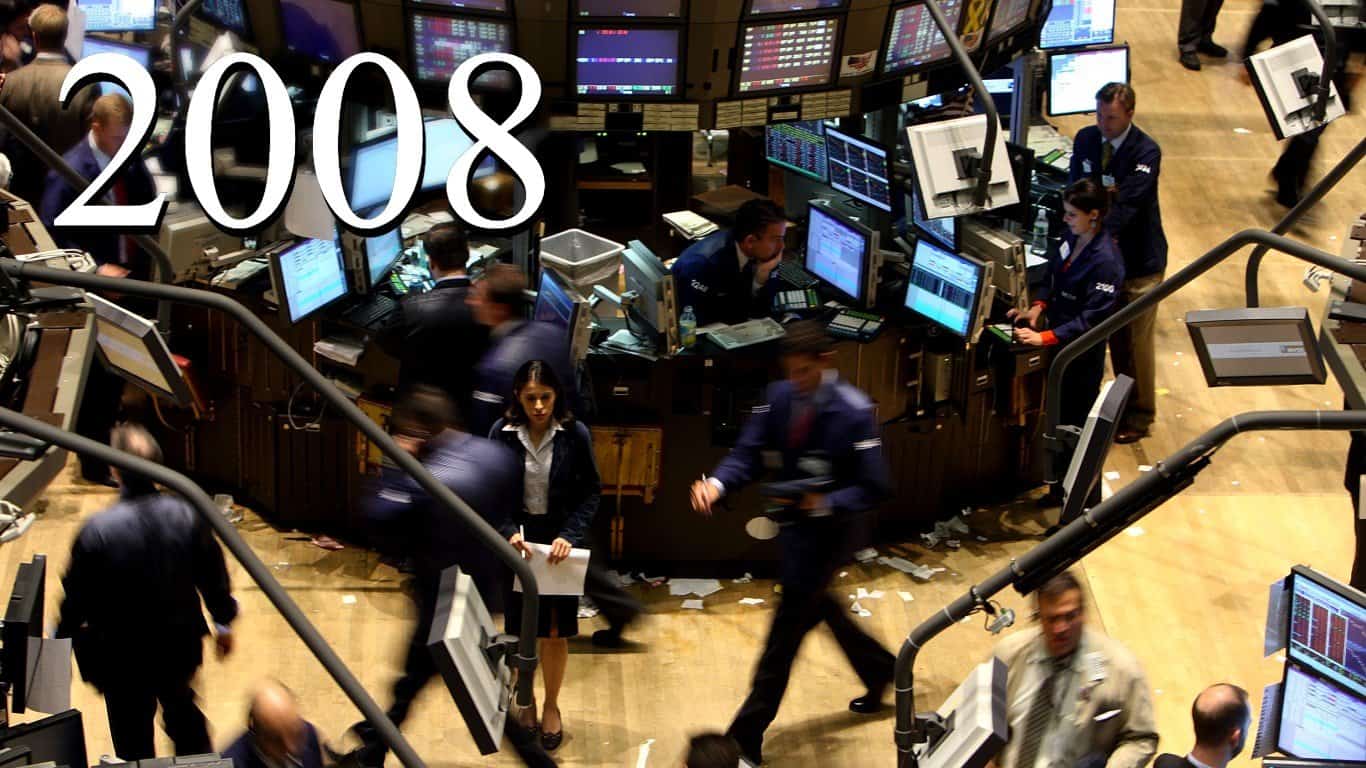
2008: $ 656.76 billion
Percent change in spending: 11.39% – 8. largest year-over-year increase
Spending as a percent of GDP: 4.45%
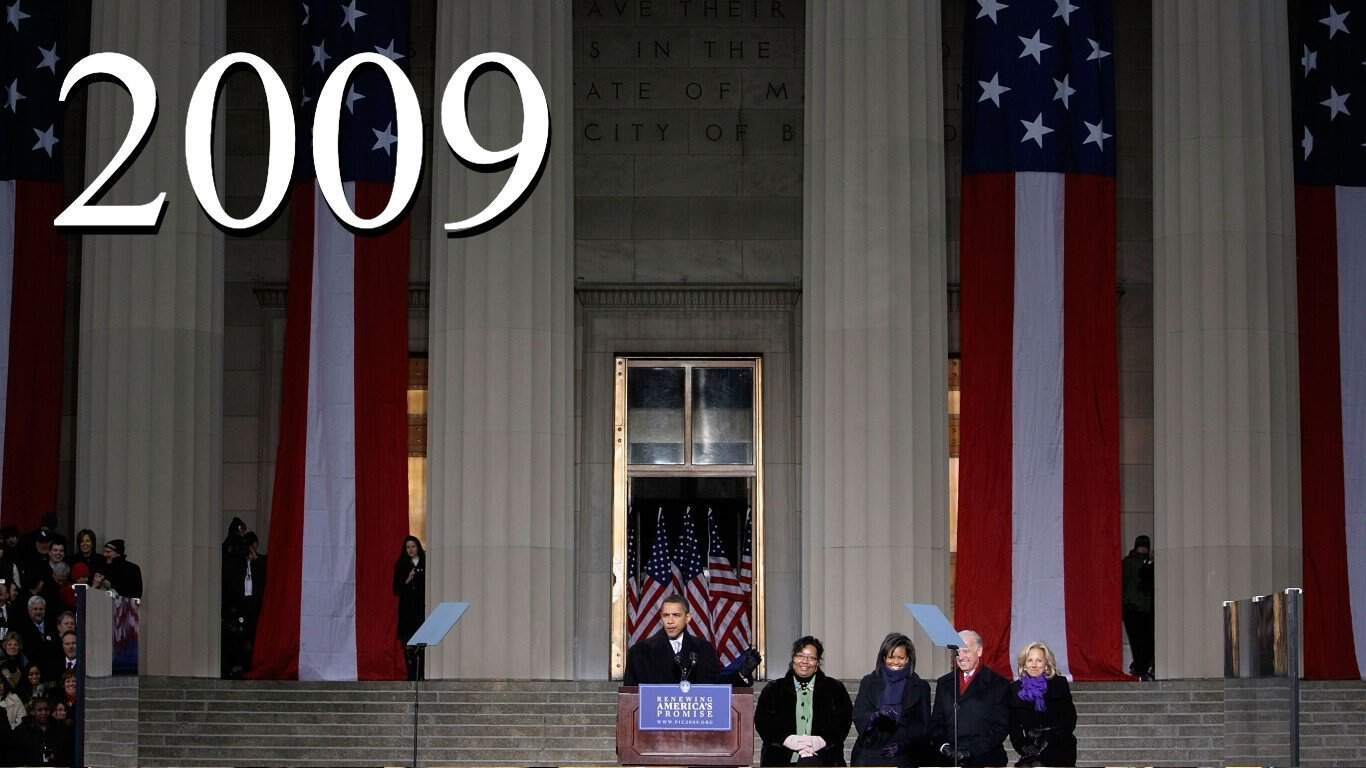
2009: $ 705.92 billion
Percent change in spending: 7.49% – 19. largest year-over-year increase
Spending as a percent of GDP: 4.88%
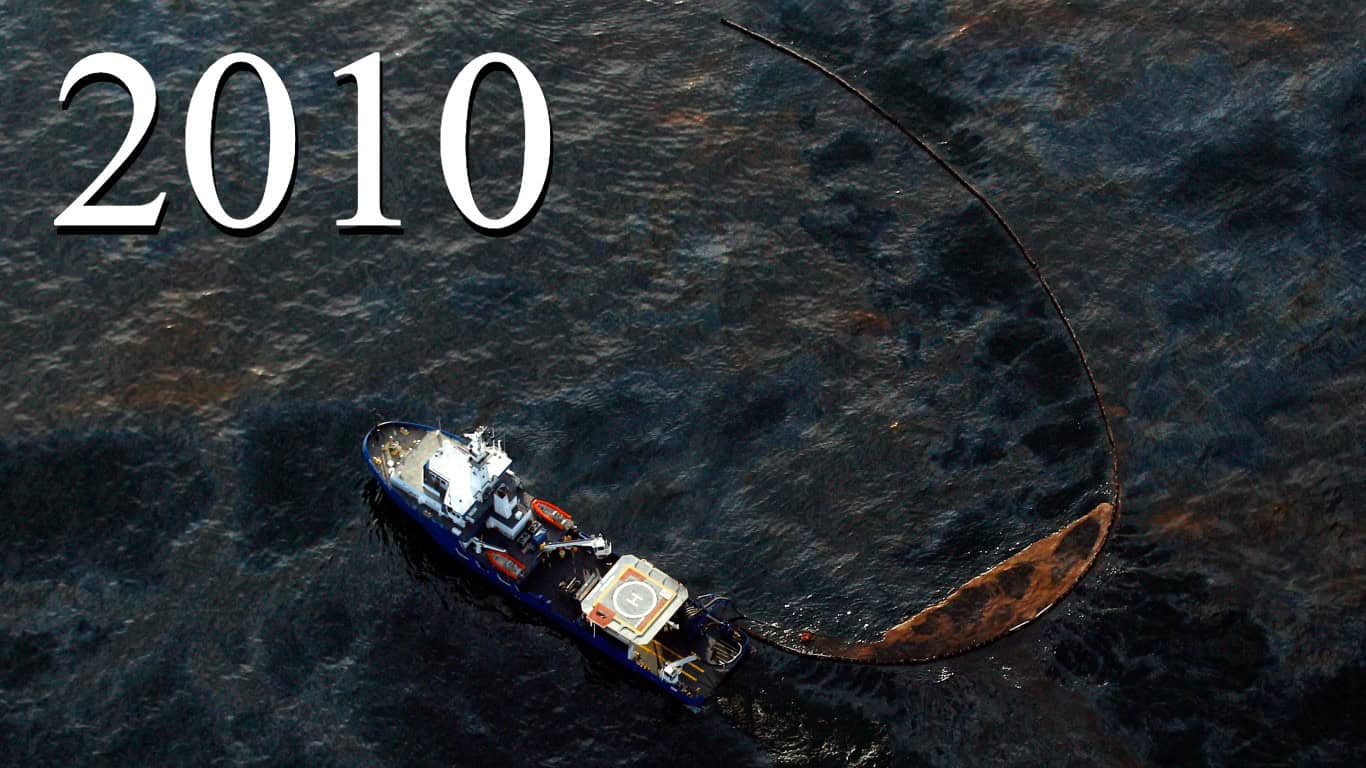
2010: $ 738.01 billion
Percent change in spending: 4.55% – 25. largest year-over-year increase
Spending as a percent of GDP: 4.90%
2011: $ 752.29 billion
Percent change in spending: 1.94% – 33. largest year-over-year increase
Spending as a percent of GDP: 4.82%
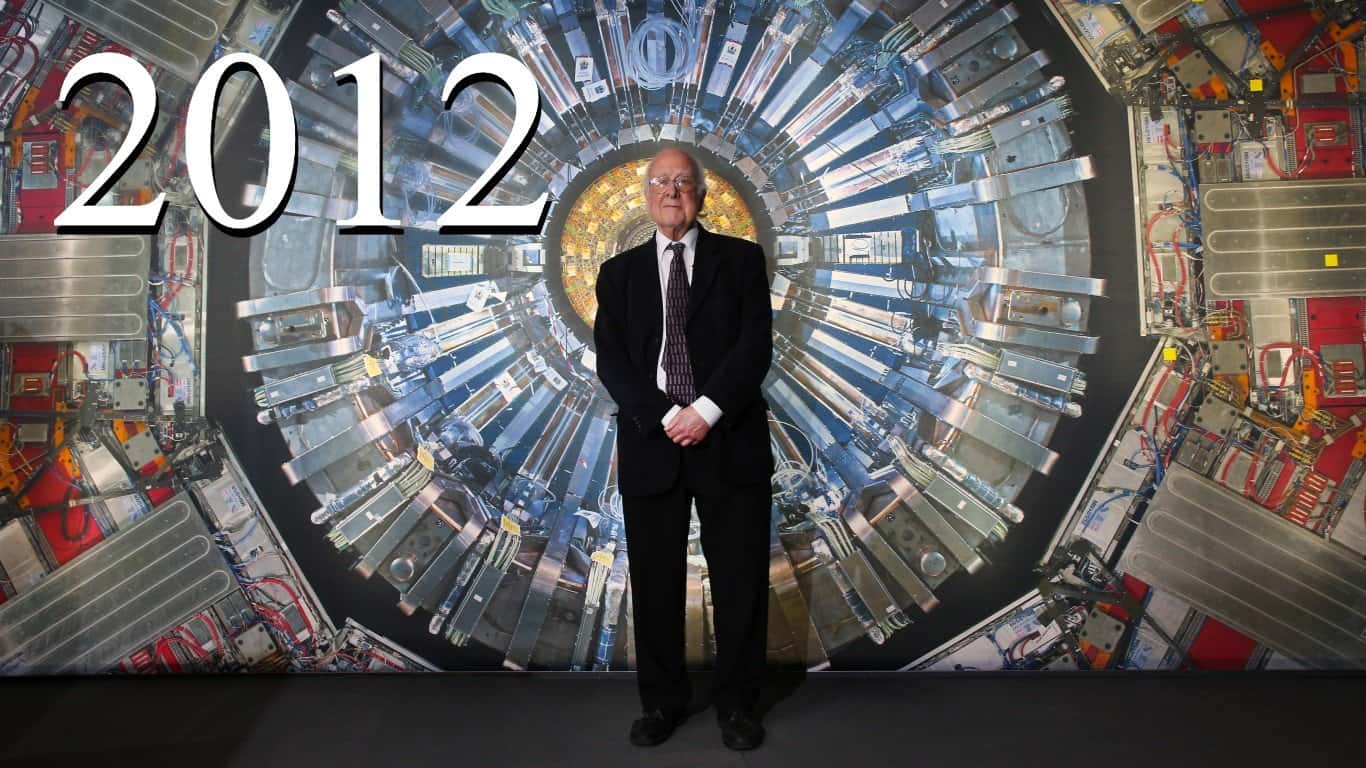
2012: $ 725.21 billion
Percent change in spending: -3.60% – 5. largest year over year decrease
Spending as a percent of GDP: 4.46%
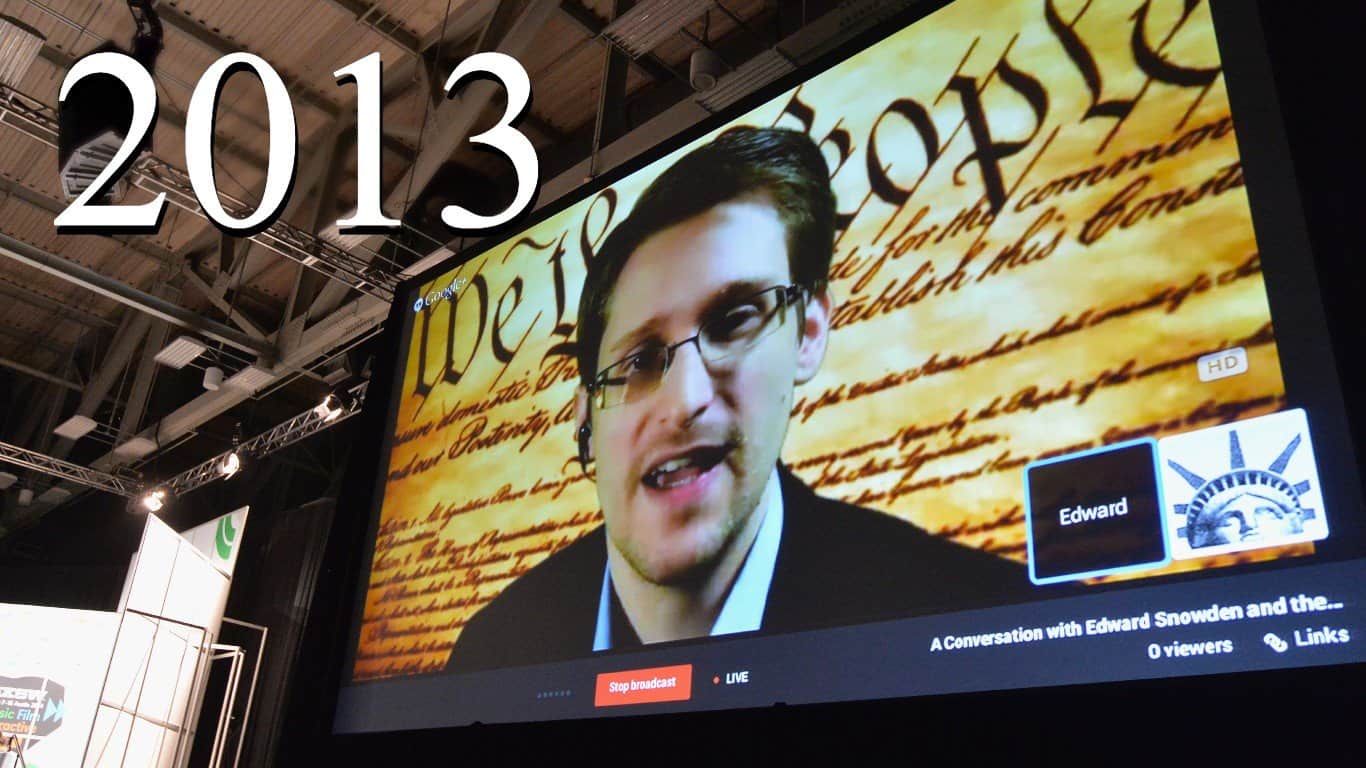
2013: $ 679.23 billion
Percent change in spending: -6.34% – 2. largest year over year decrease
Spending as a percent of GDP: 4.03%
2014: $ 647.79 billion
Percent change in spending: -4.63% – 3. largest year over year decrease
Spending as a percent of GDP: 3.69%
2015: $ 633.83 billion
Percent change in spending: -2.15% – 9. largest year over year decrease
Spending as a percent of GDP: 3.48%
2016: $ 639.86 billion
Percent change in spending: 0.95% – 38. largest year-over-year increase
Spending as a percent of GDP: 3.42%
2017: $ 646.75 billion
Percent change in spending: 1.08% – 36. largest year-over-year increase
Spending as a percent of GDP: 3.32%
2018: $ 682.49 billion
Percent change in spending: 5.53% – 23. largest year-over-year increase
Spending as a percent of GDP: 3.32%
2019: $ 734.34 billion
Percent change in spending: 7.60% – 18. largest year-over-year increase
Spending as a percent of GDP: 3.43%
2020: $ 778.40 billion
Percent change in spending: 6.00% – 21. largest year-over-year increase
Spending as a percent of GDP: 3.70%
2021: $ 806.23 billion
Percent change in spending: 3.58% – 28. largest year-over-year increase
Spending as a percent of GDP: 3.46%
2022: $ 876.94 billion
Percent change in spending: 8.77% – 13. largest year-over-year increase