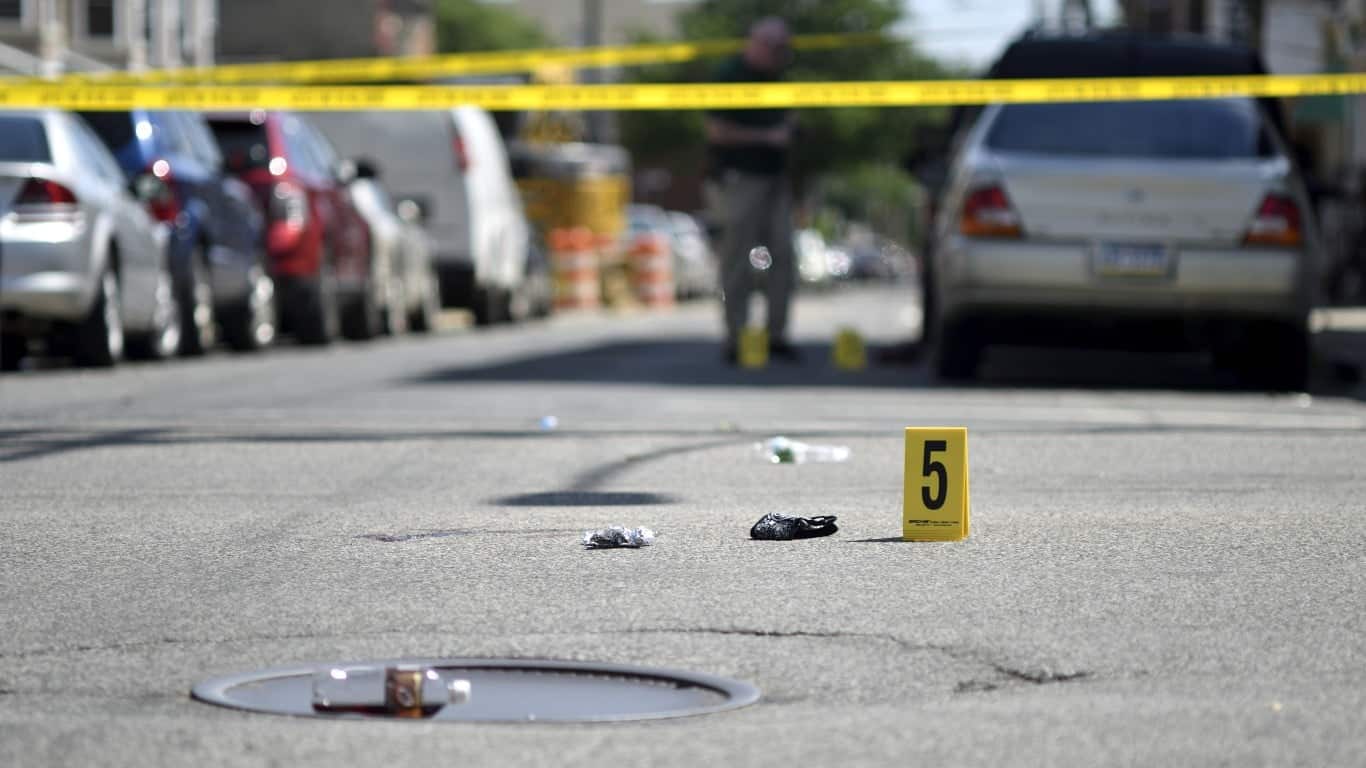


How Close You Are to America’s Most Dangerous Neighborhoods?
Crime in the United States is not evenly distributed, with some neighborhoods experiencing significantly higher levels of violence and property crime than others. While many communities remain relatively safe, certain areas face ongoing challenges tied to economic conditions, access to resources, and long-standing structural issues. Looking at where crime is most concentrated helps reveal broader patterns that shape safety across the country.
Examining these neighborhoods is not about labeling communities, but about understanding the conditions that contribute to higher crime rates and where support is most needed. Factors such as poverty, housing instability, and limited access to education and employment opportunities often play a role. According to FBI data, there were over 1.2 million reported violent crimes in the United States in 2023, including offenses like homicide, robbery, and aggravated assault. By analyzing this data, we can better understand where crime is most prevalent and what it may take to improve safety in these areas.
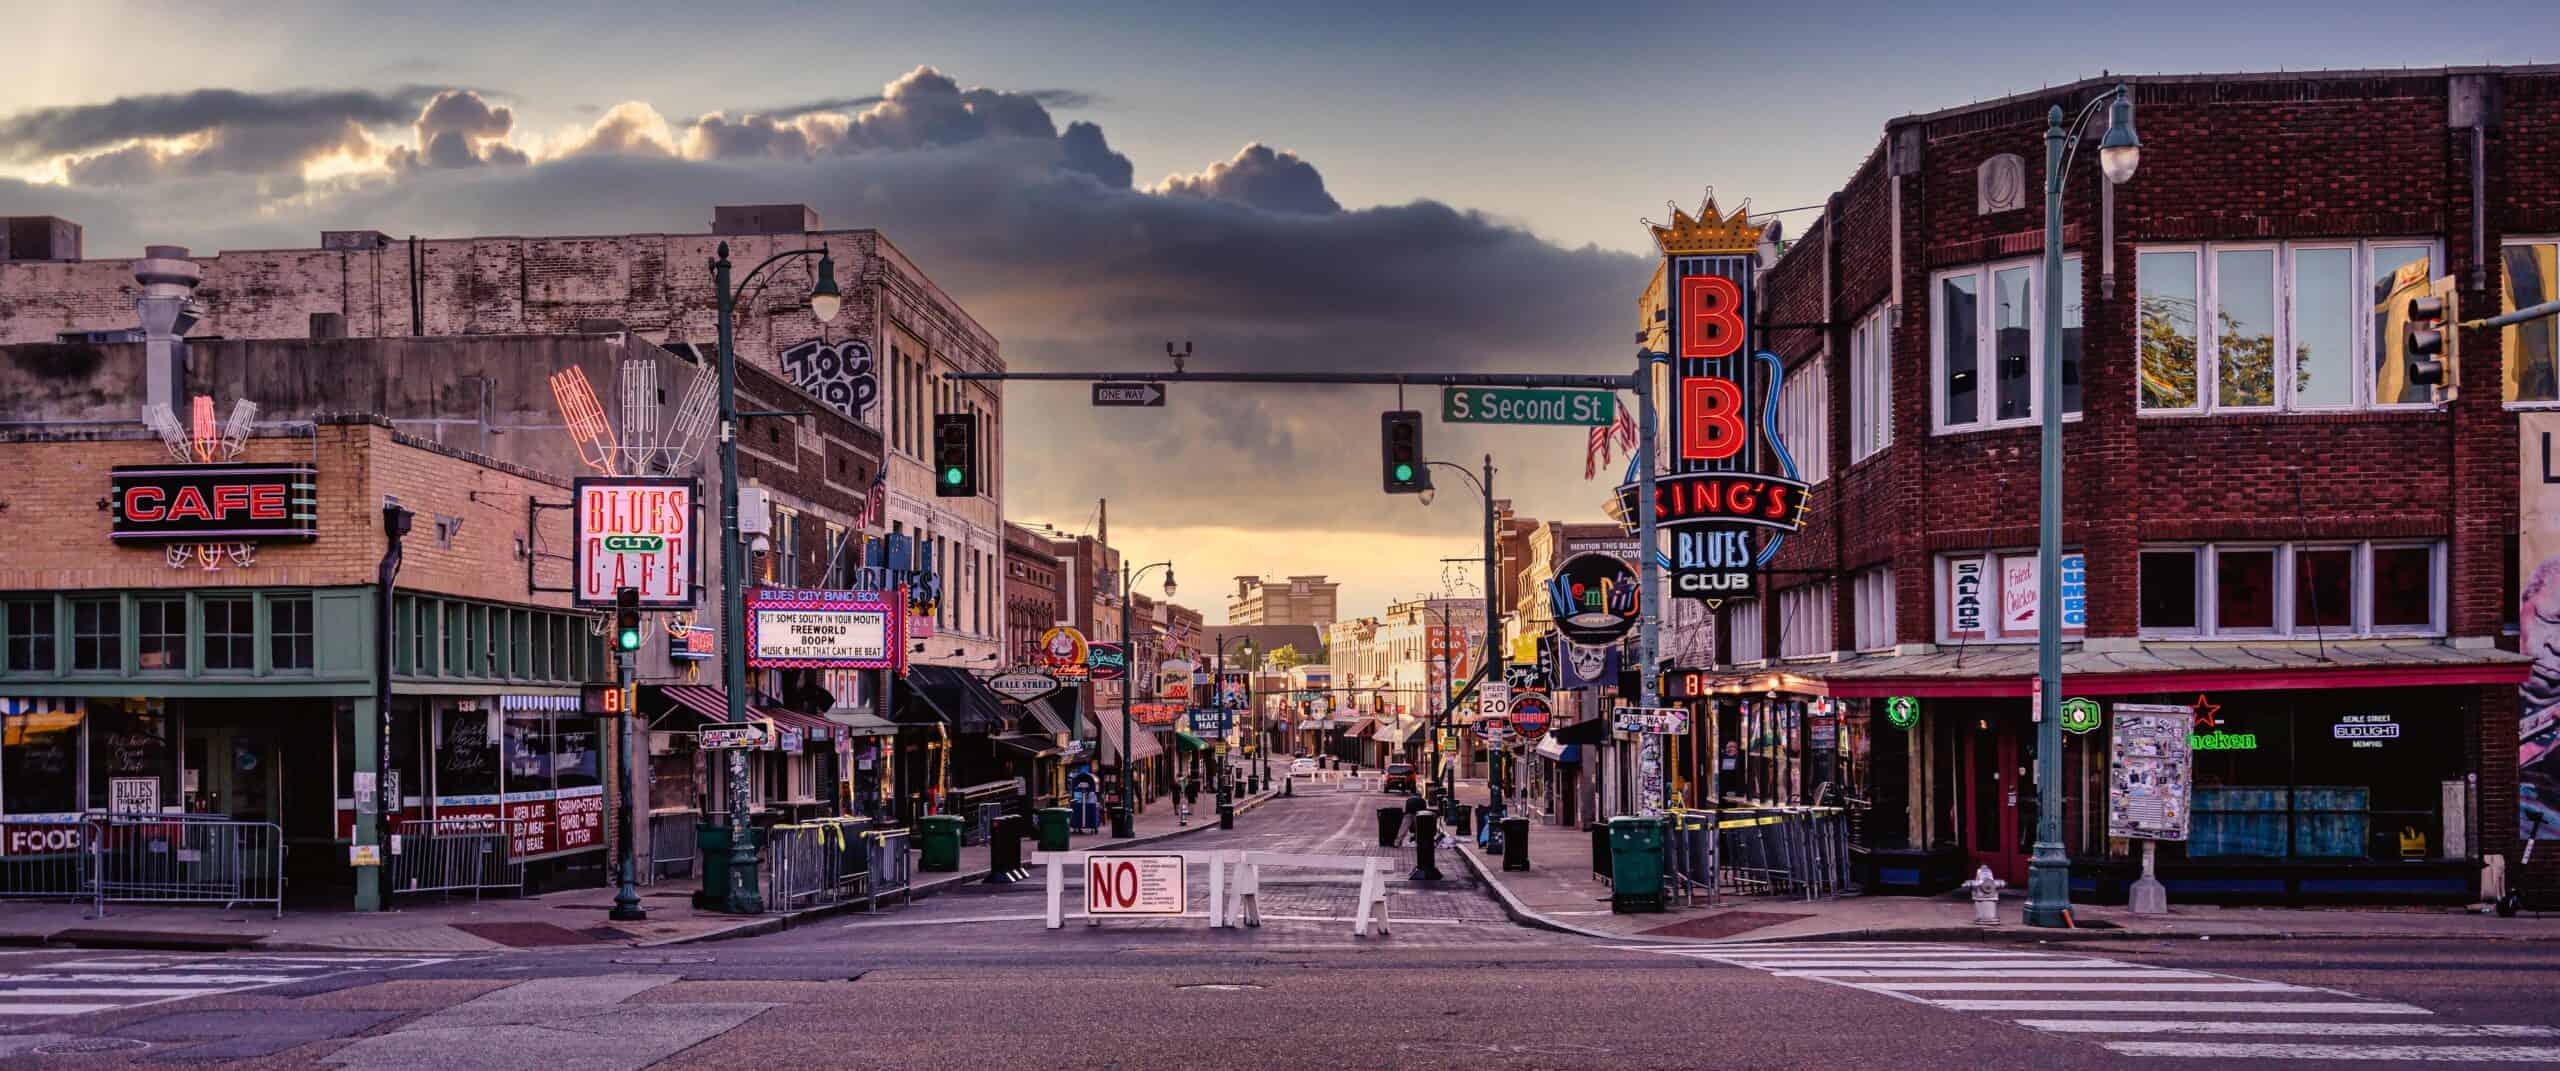
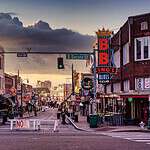
14. Shelby Forest-Frayser (Memphis)
- Neighborhood: Shelby Forest-Frayser
- Crime Rate: 90.2 per 1,000 Residents
- Most Common Crime: Property Crime
- Total Crimes in 2023: 3,101
The population of this Memphis neighborhood is 34,345. It has a median home value of $63,796 and the average household income is $30,093. Although the area has a good cost of living, it isn't accessible by public transit, isn't walkable, and locals report that neighbors aren't very friendly, and schools in the area are ranked poorly. Although there are plenty of parks (8 total) in the neighborhood, it is a food desert, with only three fast-food businesses in the area and no grocery stores.
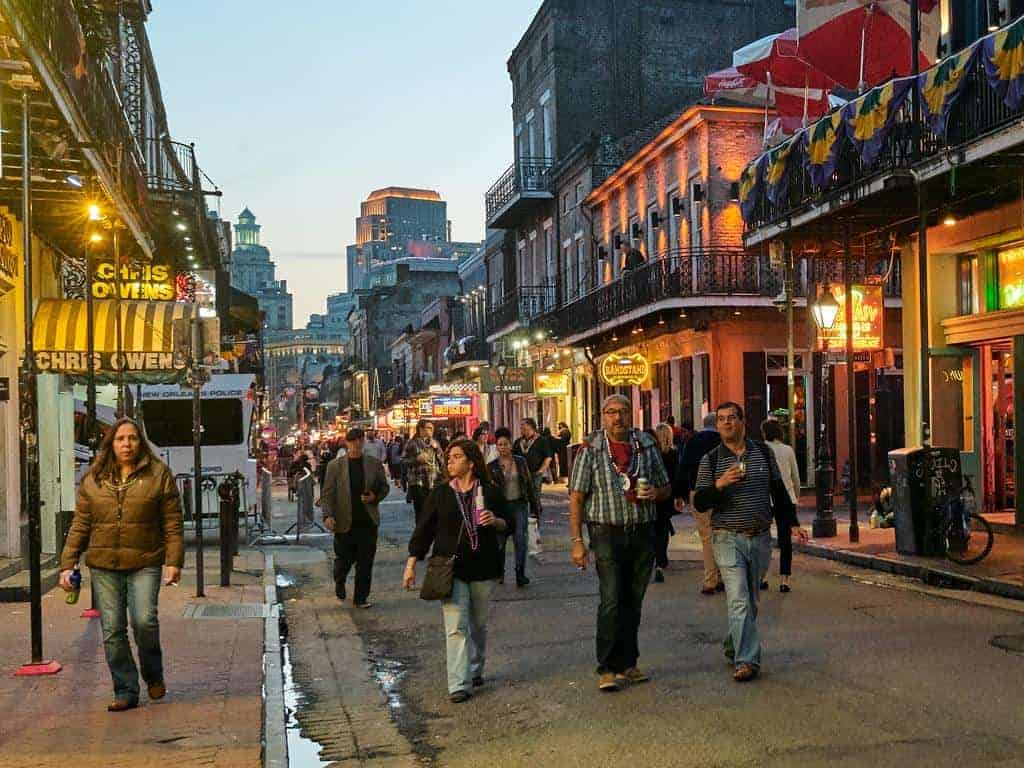
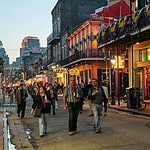
13. Pines Village (New Orleans)
- Neighborhood: Pines Village
- Crime Rate: 101 per 1,000 Residents
- Most Common Crime: Property
- Total Crimes in 2023: 390
Pines Village has a population of 3,835 residents. It has an average home value of $160,175, an average household income of $22,383, and an unemployment rate of 16.8%. This neighborhood has a population of 4,107 residents with 63% of the population renters. Despite the high-unemployment rate, all 72 schools in this area are highly rated.
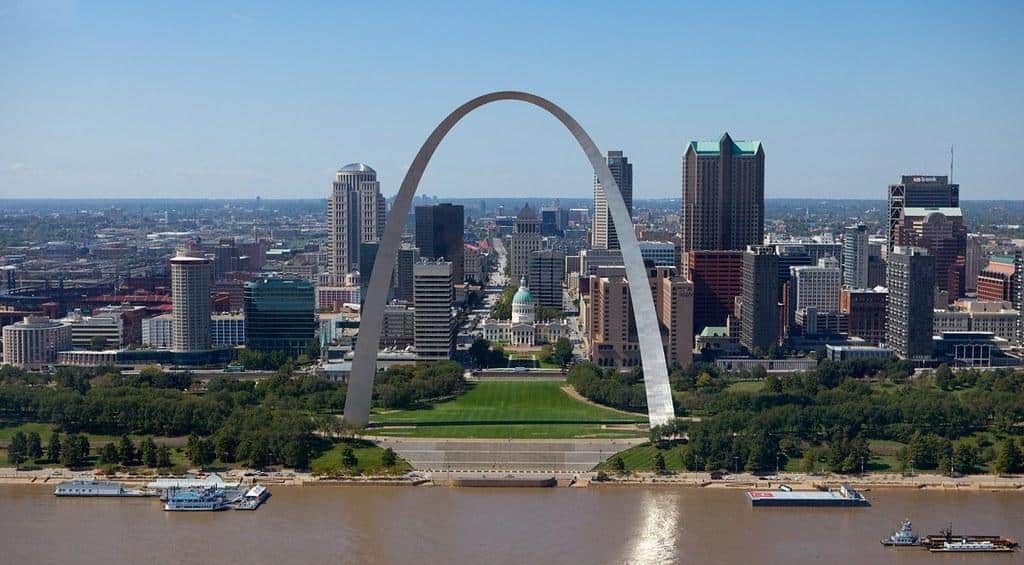
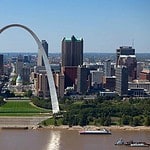
12. Peabody-Darst-Webbe (St. Louis)
- Neighborhood: Peabody-Darst-Webbe (Near Southside Neighborhood)
- Crime Rate: 120 per 1,000
- Most Common Crime: Property
- Total Crimes in 2023: 208
Peabody-Darst-Webbe has a long history of inequality and is now experiencing gentrification. In the mid-20th century, the area was home to housing projects which started to be replaced with mixed-income housing starting in the early 2000s. Now you will find great diversity, markets, walkability, and homes ranging from condos, and rowhomes, to modern single-family homes. An upcoming $150 Million redevelopment project to start in 2025 will modernize and update the neighborhood even further.
The unemployment rate is 10.7%, and the median household income is $48.840 with a population of 1,652.
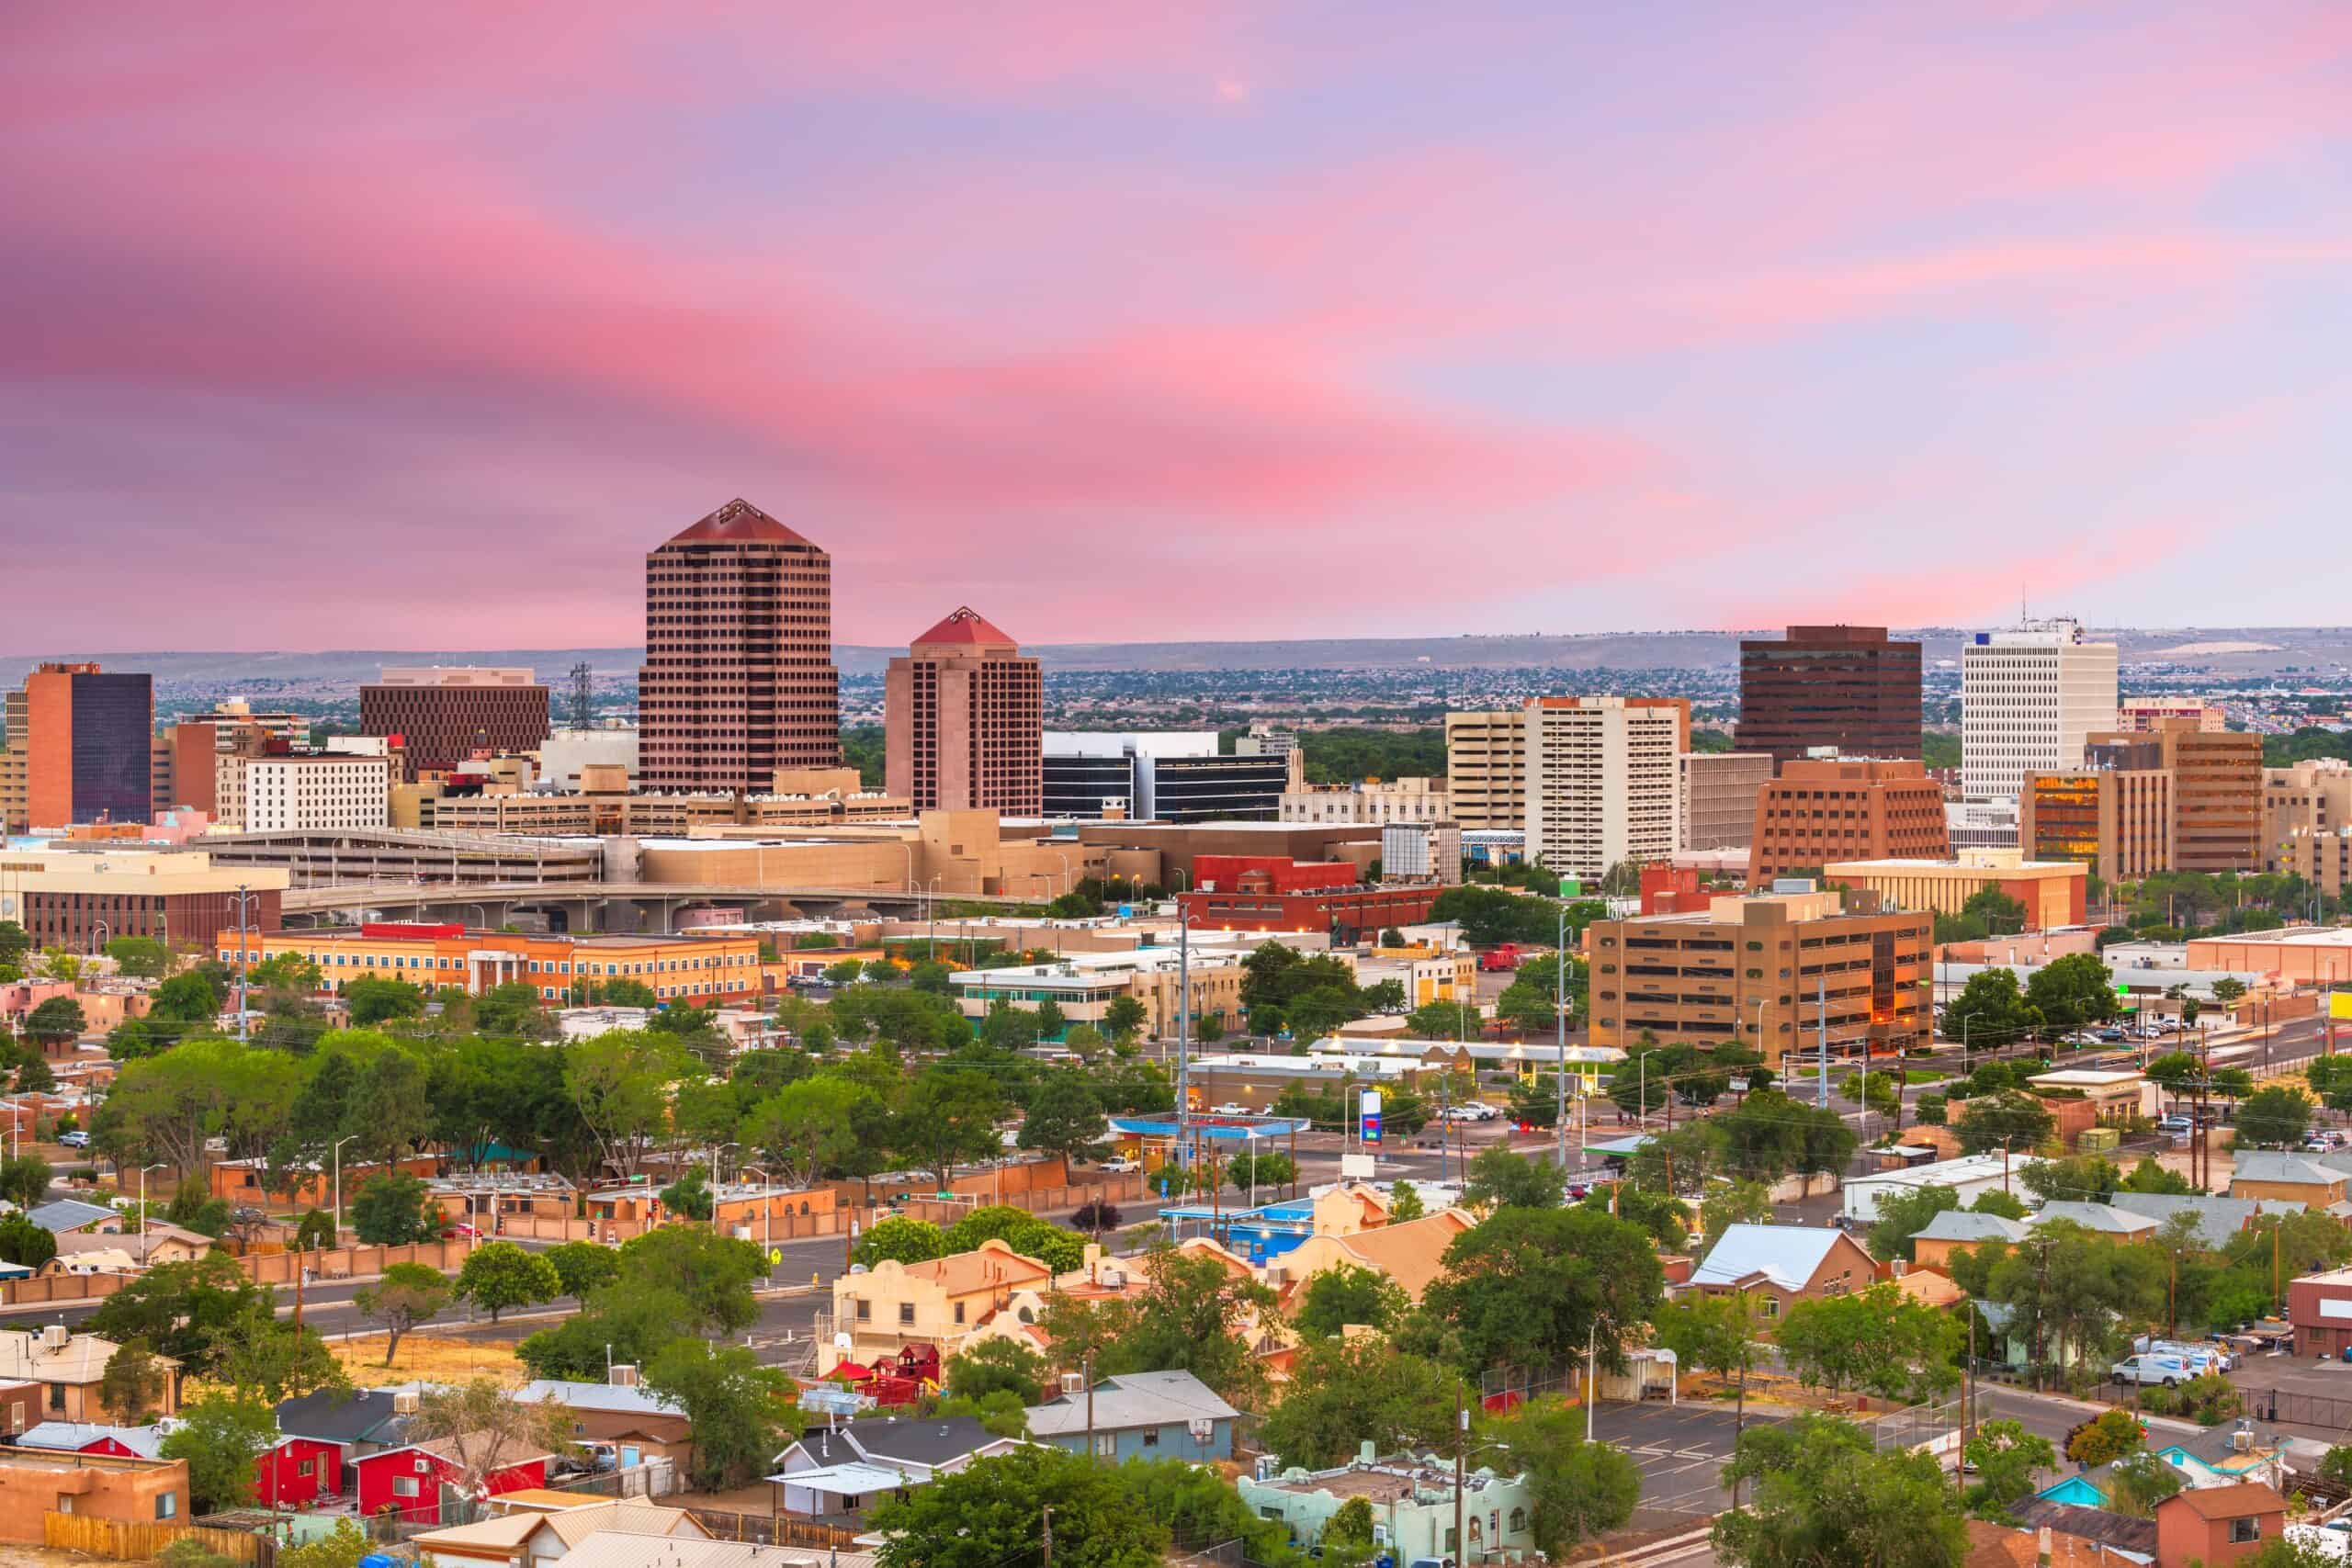
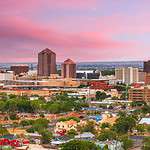
11. Quigley Park (Albuquerque)
- Neighborhood: Quigley Park
- Crime Rate: 142.7 per 1,000 residents
- Most Common Crime Type: Property
- Total Crimes in 2023: 108
Quigley Park is home to less than 1,000 full-time residents. With such few residents, it is surprising that the crime rate is 514% higher than the national average. The median household income in Quigley Park is $69,432, and the unemployment rate is 2.1%. The average home value is $185,400. There are shops, grocery stores, and a large park in Quigley Park.
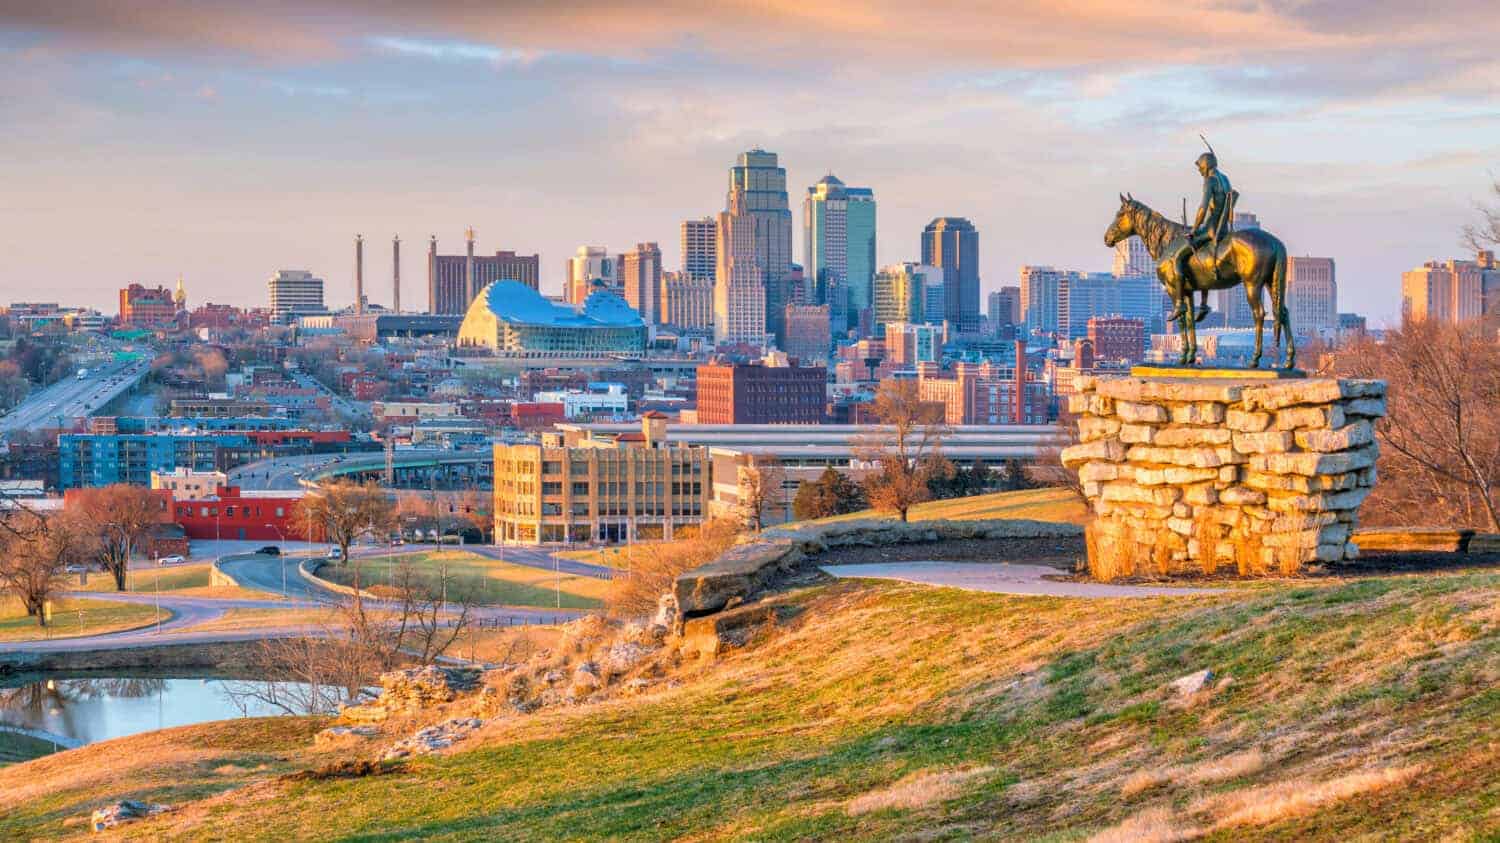
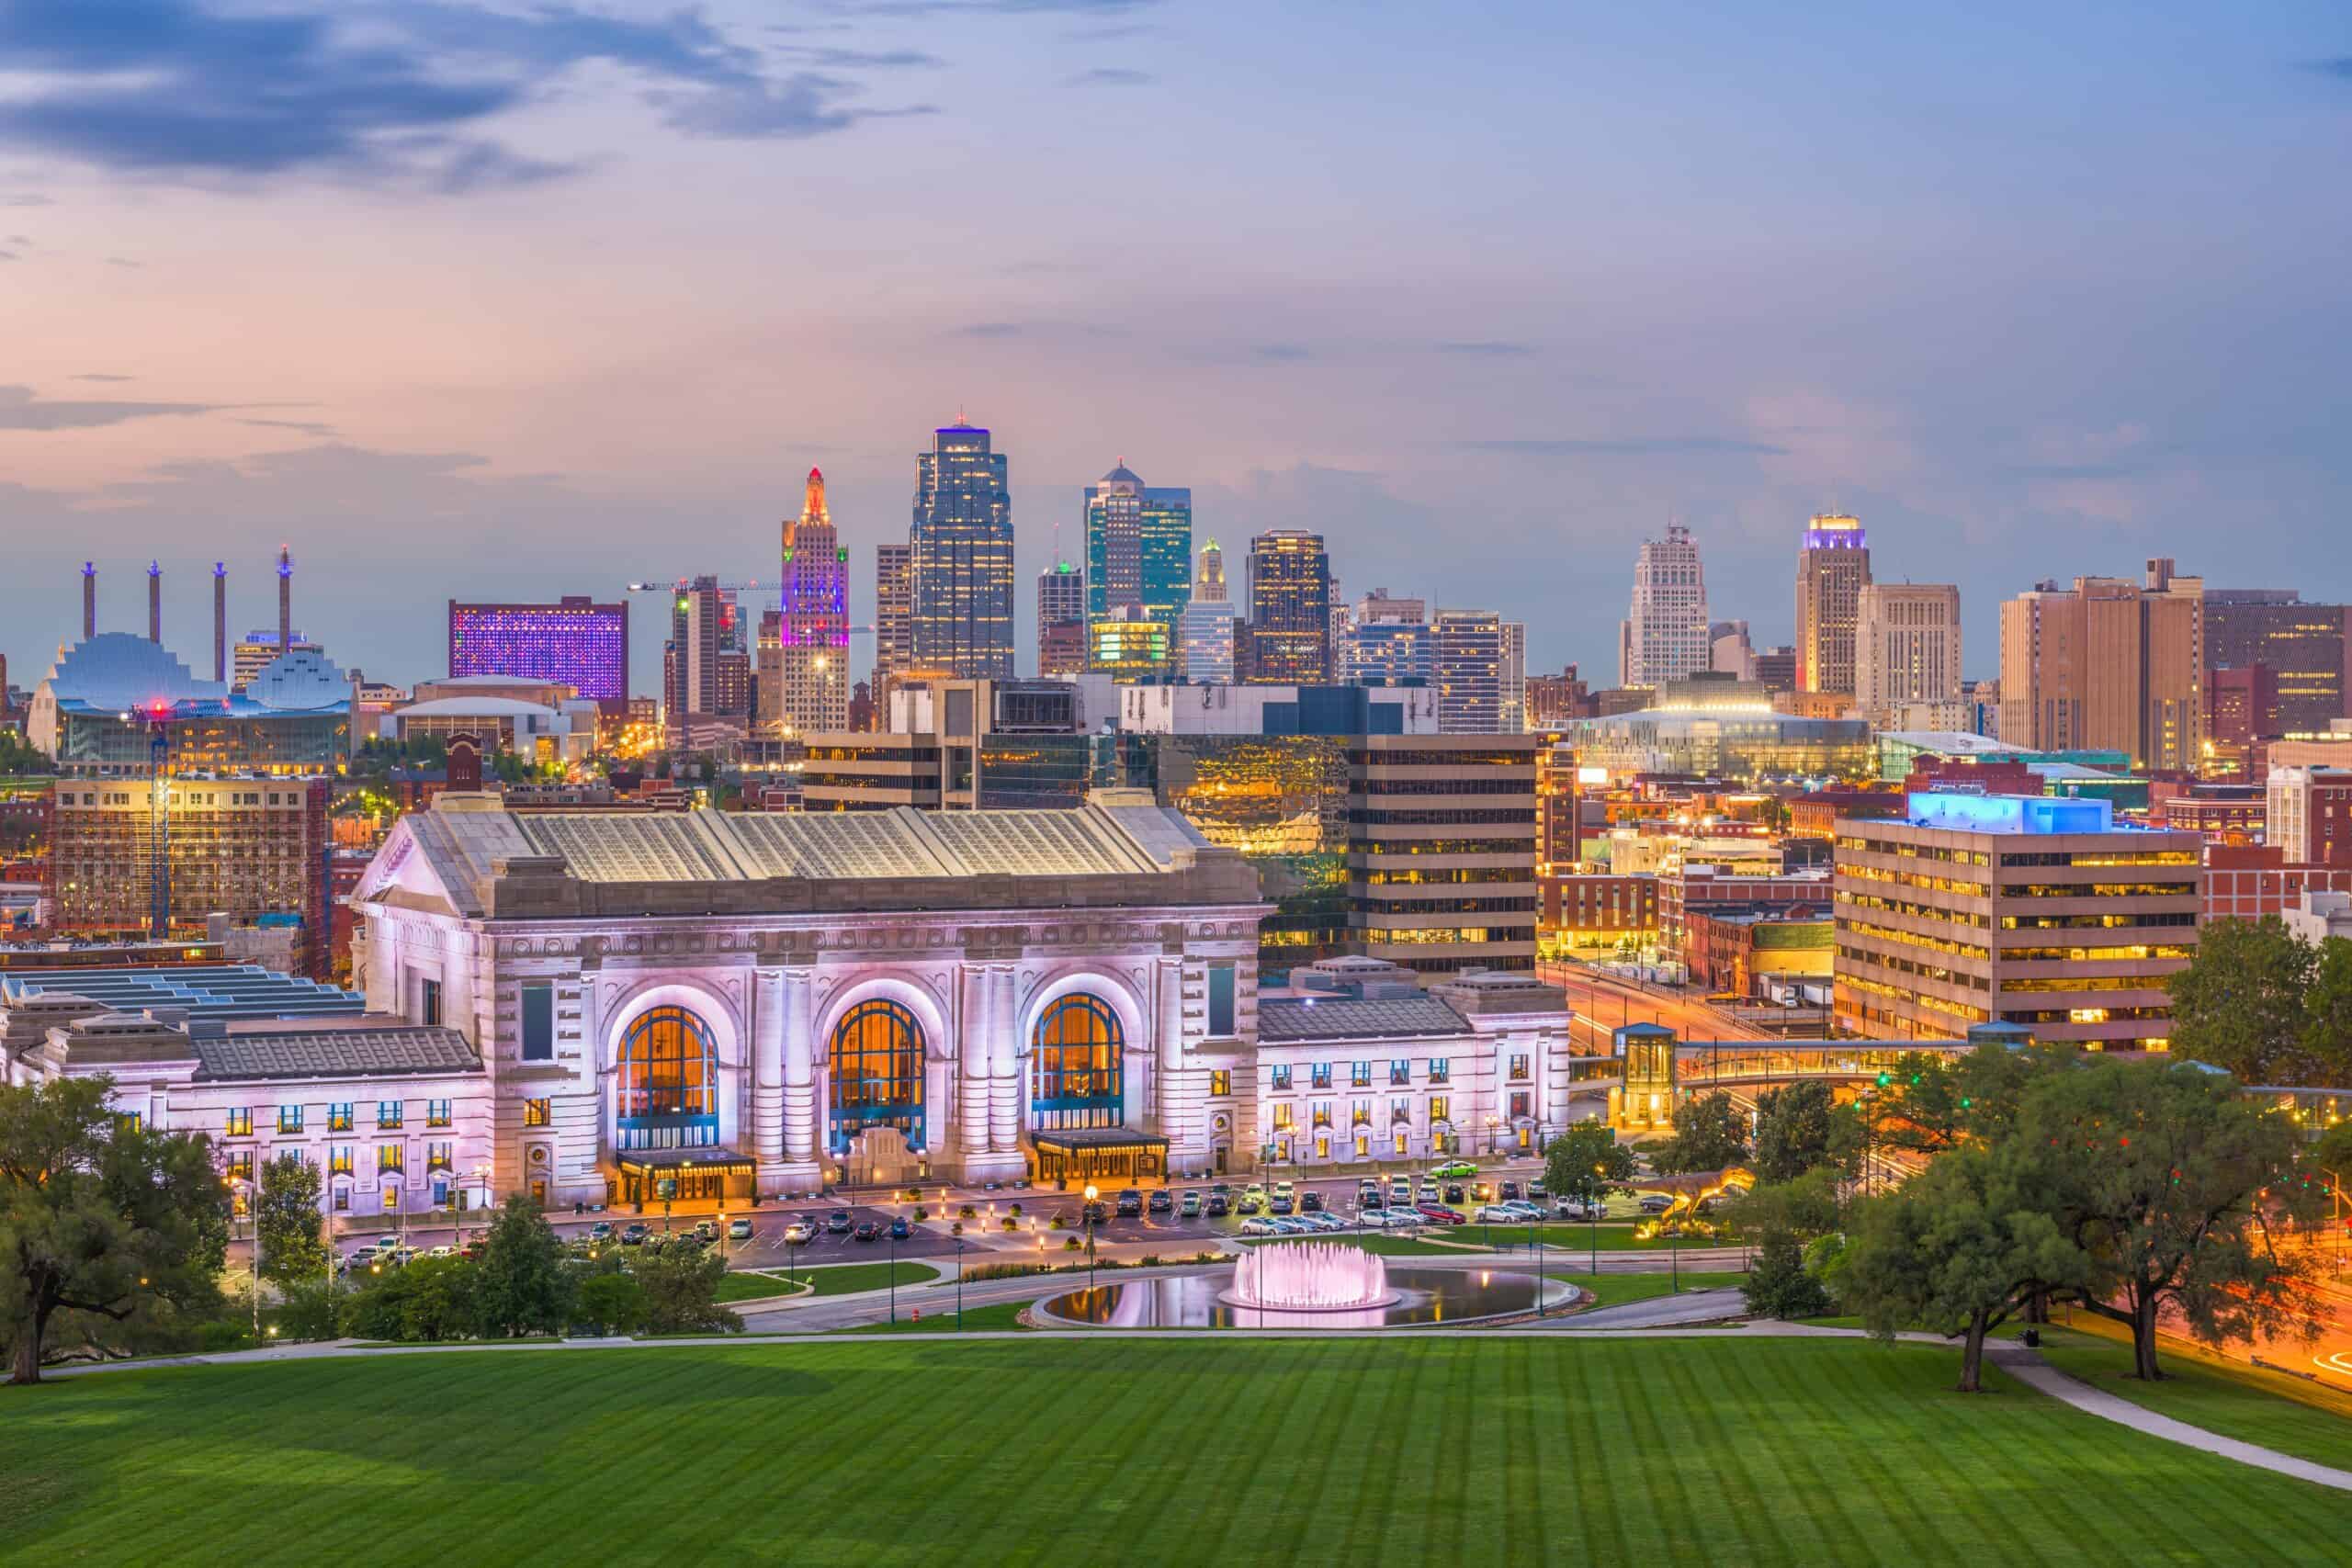
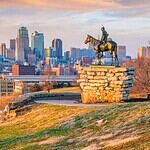
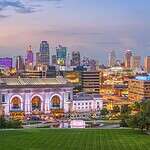
10. Ann Ave and North 3rd Street (Kansas City)
- Neighborhood: Bordered by Ann Ave., N. 10th St., Washington Blvd., and N. 3rd St.
- Crime Rate: 204 crimes per 1,000 residents
- Most Common Crime: Violent Crime
- Total Crimes in 2023: 187
Poverty is a contributing factor in this neighborhood of Kansas City, being a part of the 0.2% most impoverished neighborhoods nationally. The median household income is $11,000 per year, and over 66% of residents are unemployed. This figure could be because the average age of the residents is 50.9 for males and 49.5 for females.
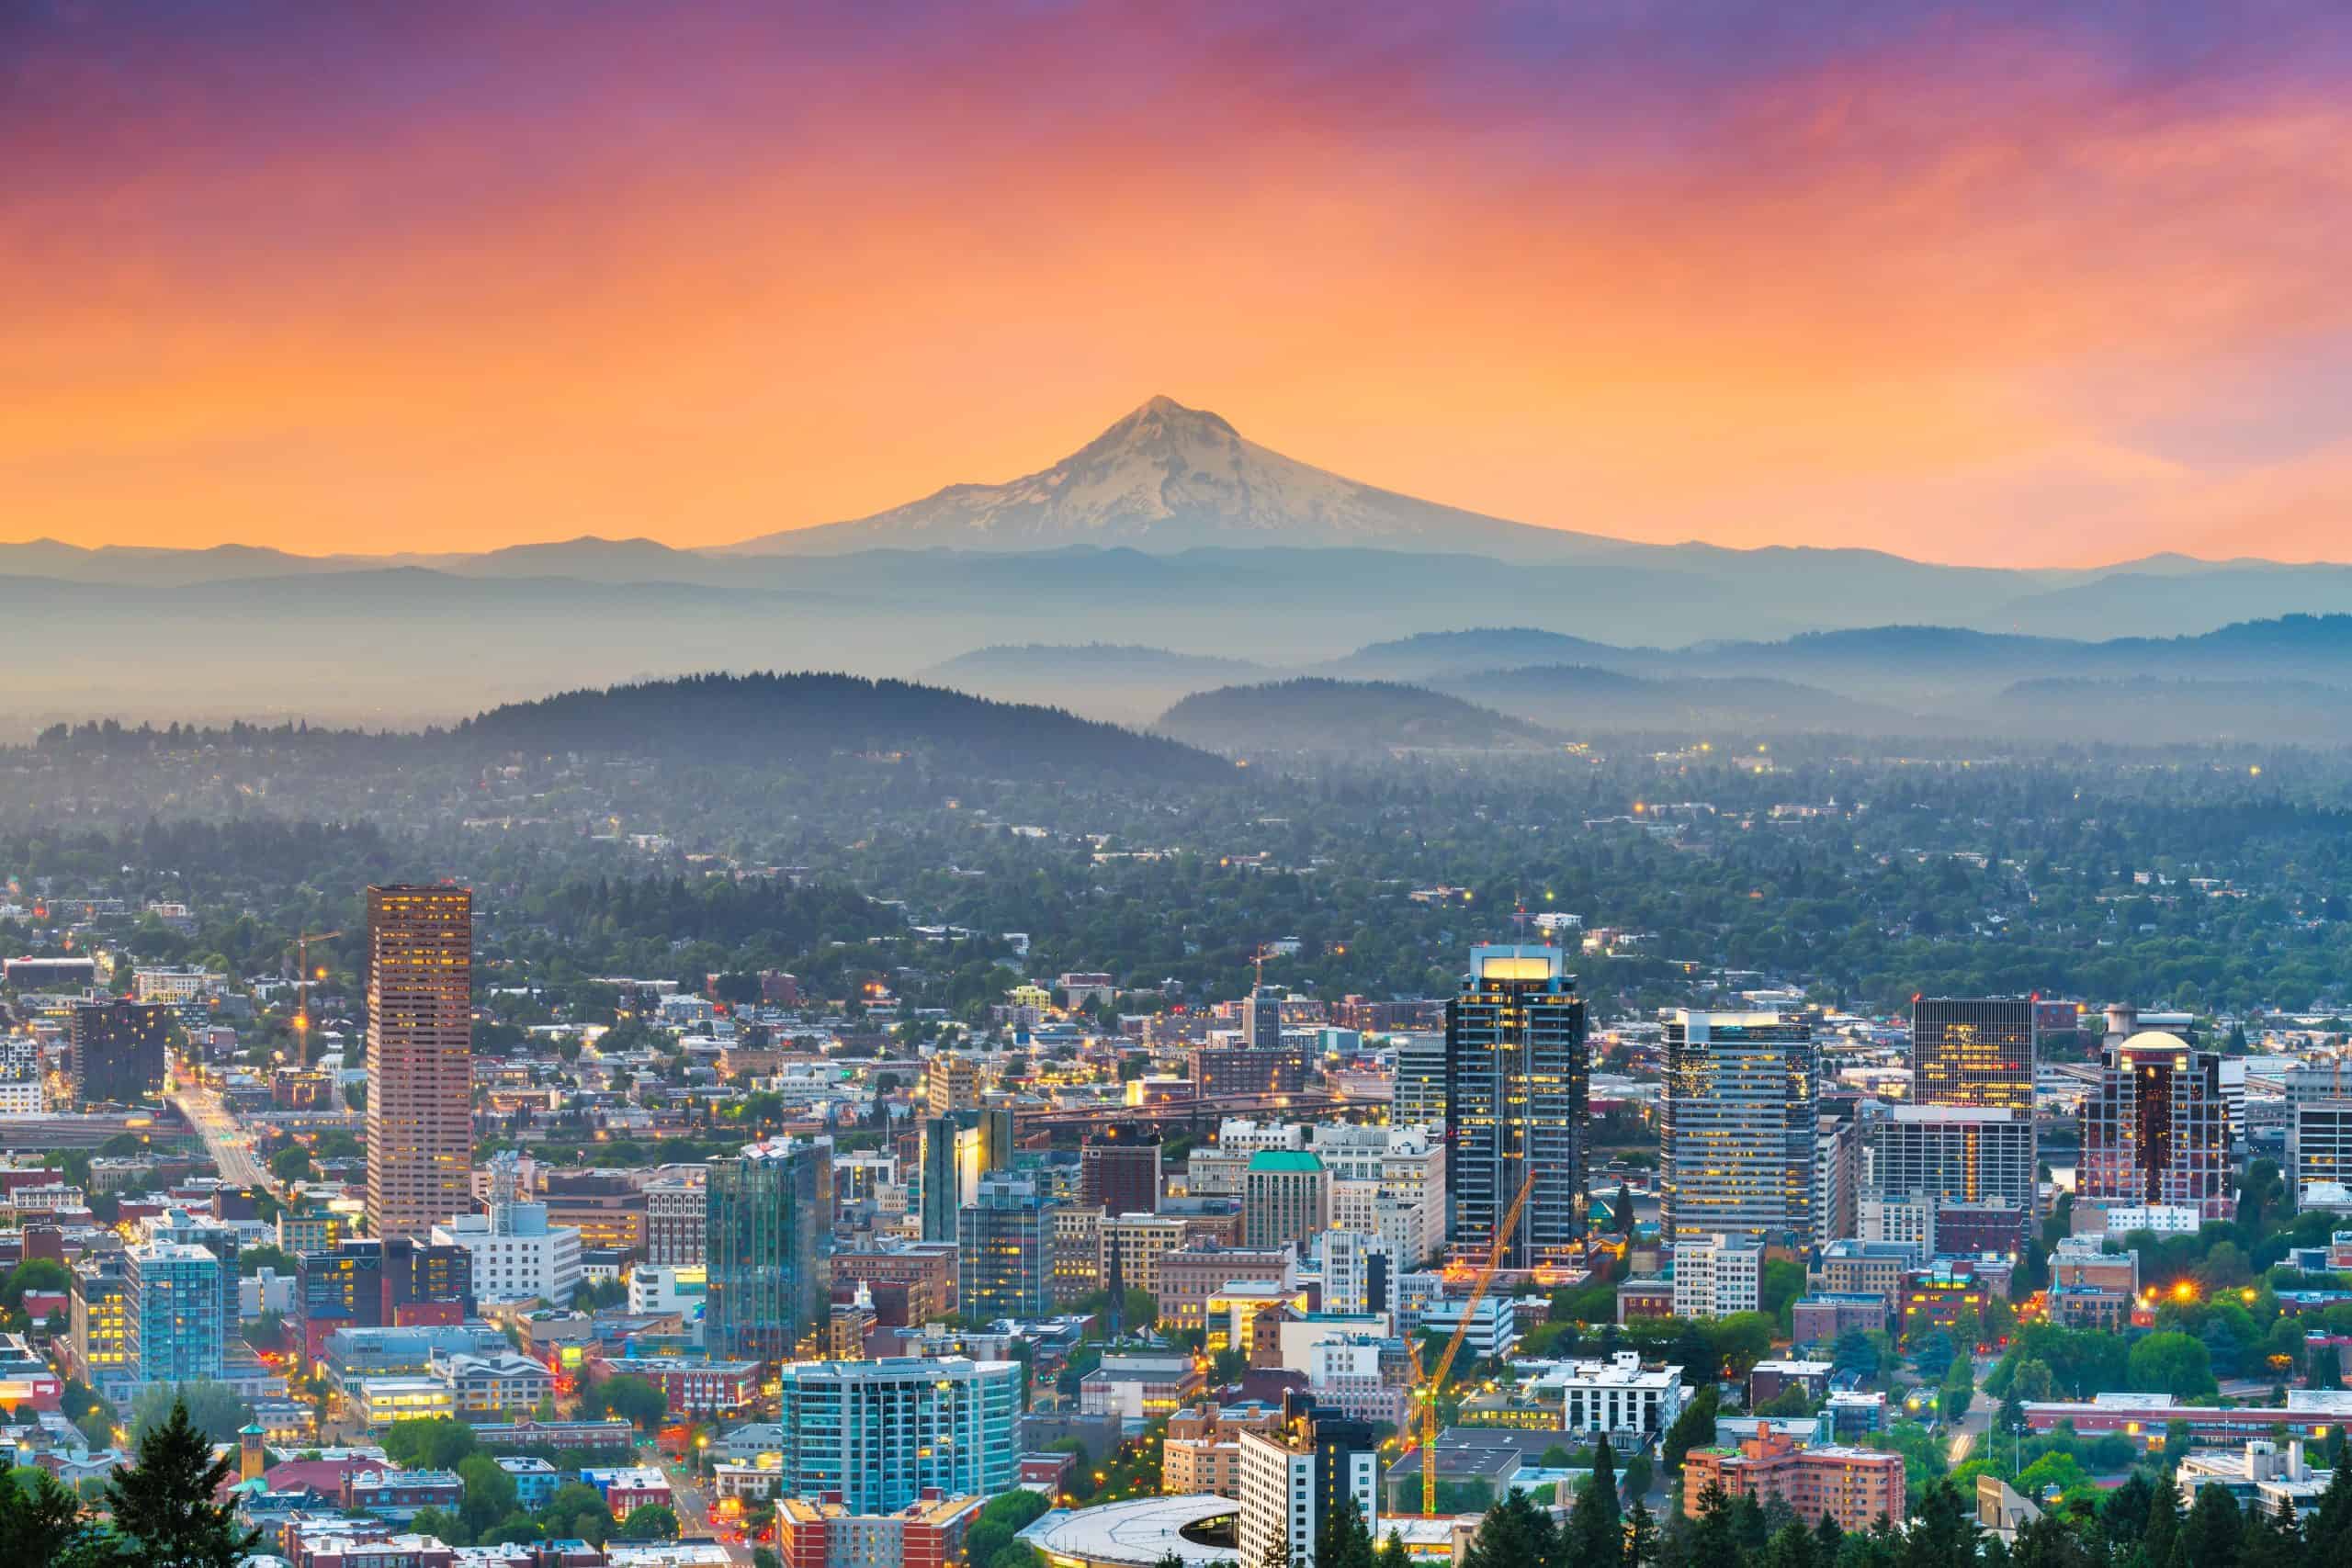
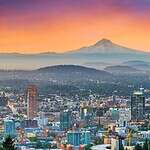
9. Steel Bridge and Pacific Highway (Portland)
- Neighborhood: Bordered by Steel Bridge, Willamette River, Fremont Bridge, N. Russel St., N. Williams Ave., NE Hancock St., Pacific Highway, and the BNSF Railroad
- Crime Rate: 210 Crimes per 1,000 Residents
- Most Common Crime: Violent
- Total Crimes in 2023: 181
This neighborhood block is interesting in that 65% of the residents were new to the area, and the unemployment rate is higher than 96% in the country. Poverty is high in the area, with 28% of the households having a median income of less than $10,000 annually.
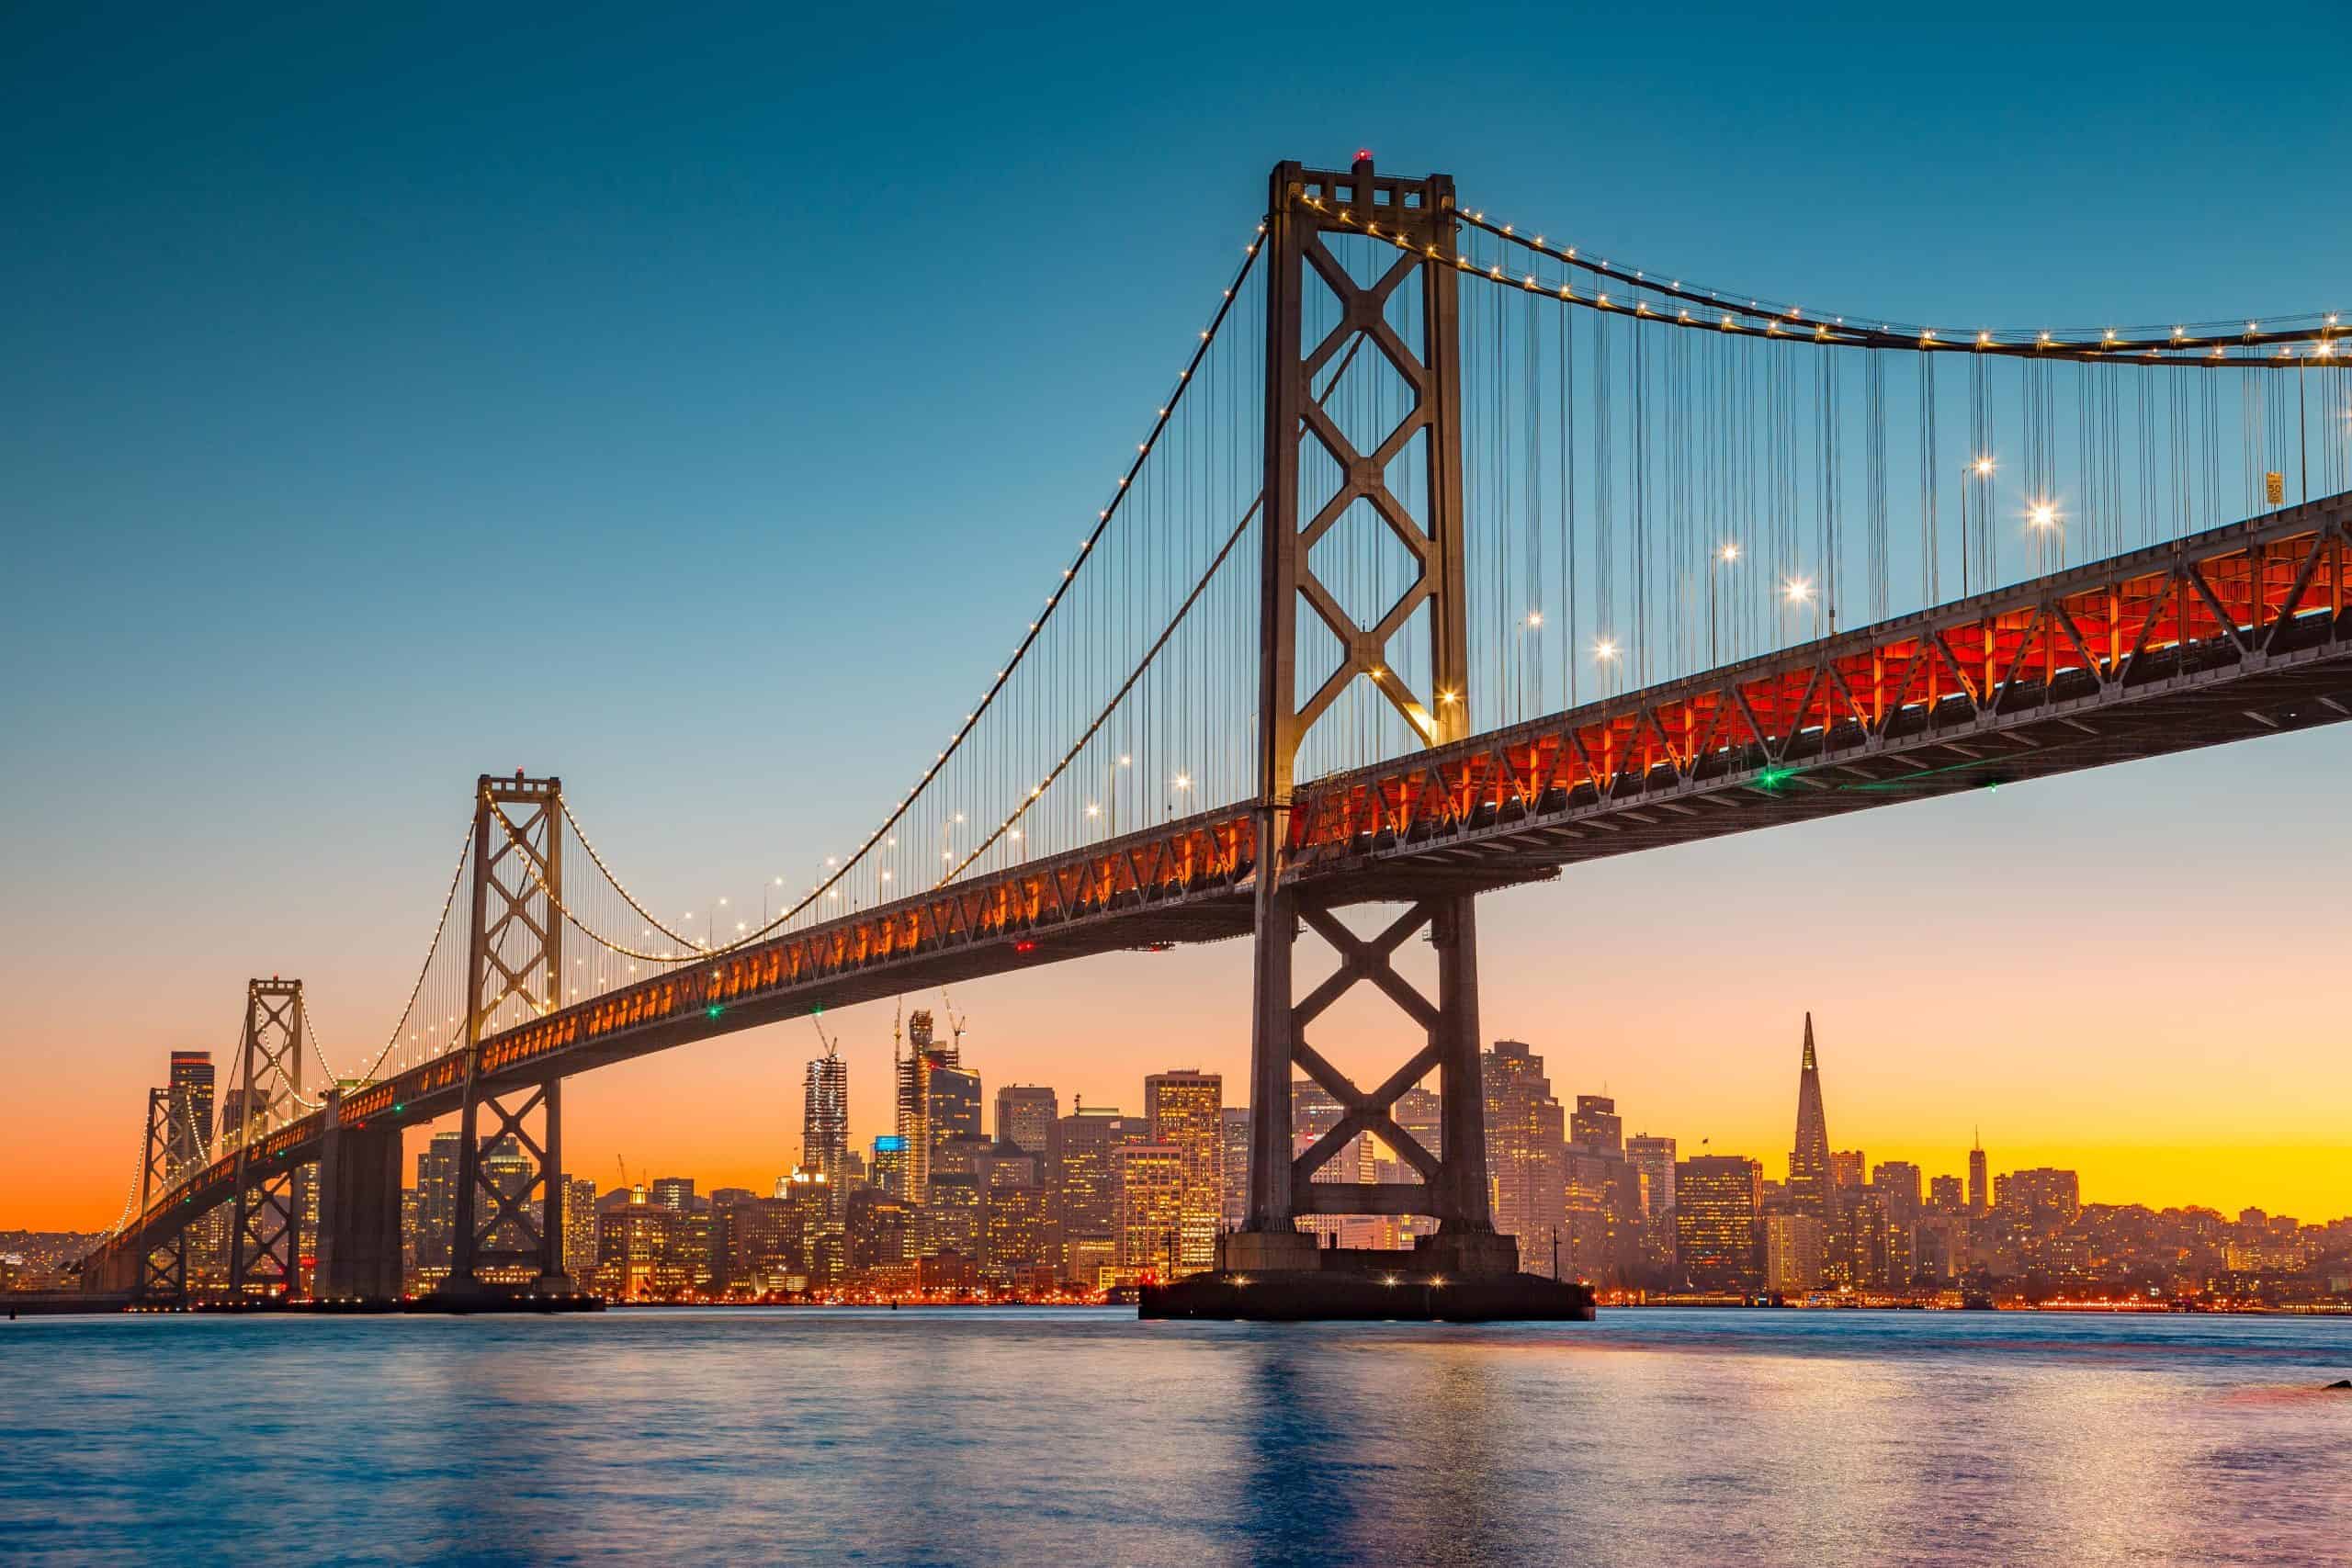
8. Turk Street and Market Street (San Francisco)
- Neighborhood: Bordered by Turk St., Taylor St., Ellis St., Powell St., and Market Street
- Crime Rate: 203 crimes per 1,000 Residents
- Most Common Crime Type: Violent
- Total Crime Rate in 2023: 242
The average income in this neighborhood is $20,583, with 60% of the population unemployed. Along with other neighborhoods, some commonalities are a high percentage of males (66%), and average age of 55 years.
7. Market Street and 1st Street (San Francisco)
- Neighborhood: Bordered by Market St., Powell St, Bush St., and 1st St.
- Crime Rate: 247 per 1,000
- Most Common Crime Type: Property Crime
- Total Crime Rate in 2023: 227
The popular Union Square in San Francisco is included in this neighborhood. Property crime is high, which includes theft, destruction, burglary, vandalism, and arson. Union Square receives about 13 million visitors per year. High-fashion luxury brands like Gucci, Balenciaga, Aritzia, Cartier, Chanel, and Giorgio Armani have their flagship stores there. Other shops range from CVS to Footlocker to FedEx, to Banana Republic; Union Square has the highest concentration of shops in the city.
6. 7th Street and San Julian Street (Los Angeles)
- Neighborhood: Bordered by E. 7th St., S. Los Angeles St., E. 5th St., and San Julian St.
- Crime Rate: 226 per 1,000
- Most Common Crime: Violent and Property
- Total Crime Rate in 2023: 407
The median household income of this block group is $10,397 per year, and has one of the highest proportions of males in the nation at 86%. The average age is 56 years old, which may greatly contribute to the high unemployment rate of 68% of residents.
5. East 8th Street and Cleveland Ave. (Kansas City)
- Neighborhood: Bordered by E. 8th St. Prospect Ave., E. 12th St., and Cleveland Ave.
- Crime Rate: 304 crimes per 1,000
- Most Common Crime: Violent Crime
- Total Crimes in 2023: 182
Residents in this area have a household income of $20,391. There is also a 56% unemployment rate. Besides this, there is a popular park and stadium in the area, making traffic and tourism higher than the surrounding neighborhoods.
4. Division Street and Townsend Street (San Francisco)
- Neighborhood: Bordered by Division St., 11th St., Harrison St., and Townsend St.
- Crime Rate: 298 Crimes Per 1,000 Residents
- Most Common Crime: Violent and Property Crime
- Total Crime Rate in 2023: 296
This block group is part of Downtown San Francisco. Although the median household income in this group is high, $158,958, the surrounding neighborhoods have meager median household incomes, some as low as less than $10,000 per year. That plus high tourism, traffic, and shopping in the area may contribute to the high violent and property crime rate.
3. 7th Street and Alameda Street (Los Angeles)
- Neighborhood: Augurisk Now 3 (Bordered by E. 7th St., S. San Pedro St., E. 5th St., and S. Alameda St.)
- Crime Rate: 291 per 1,000 residents
- Most Common Crime: Violent and Property Crime
- Total Crime Rate in 2023: 456
The median household income for this particular block group was $7,188 in 2018. That statistic makes it among one of the 65thpoorest neighborhoods in the country. A shared similarity with the other two LA block groups is a high percentage of male residents (69%), the difference in this neighborhood is that the median age among residents is 53 years old.
2. Santa Monica and Maple Ave (Los Angeles)
- Neighborhood: Bordered by Santa Monica Fwy., Maple Ave., E. 9th., and E. 7th St., Gladys Ave., E. Olympic Blvd., and S. Alameda St.
- Crime Rate: 293 per 1,000 residents
- Most Common Crime: Violent and Property Crime
- Total Crime Rate: 407
Some of the statistics in this neighborhood block have many similarities to the most dangerous block group. In this group, 64% are male, with a low unemployment rate. This neighborhood is also in downtown Los Angeles.
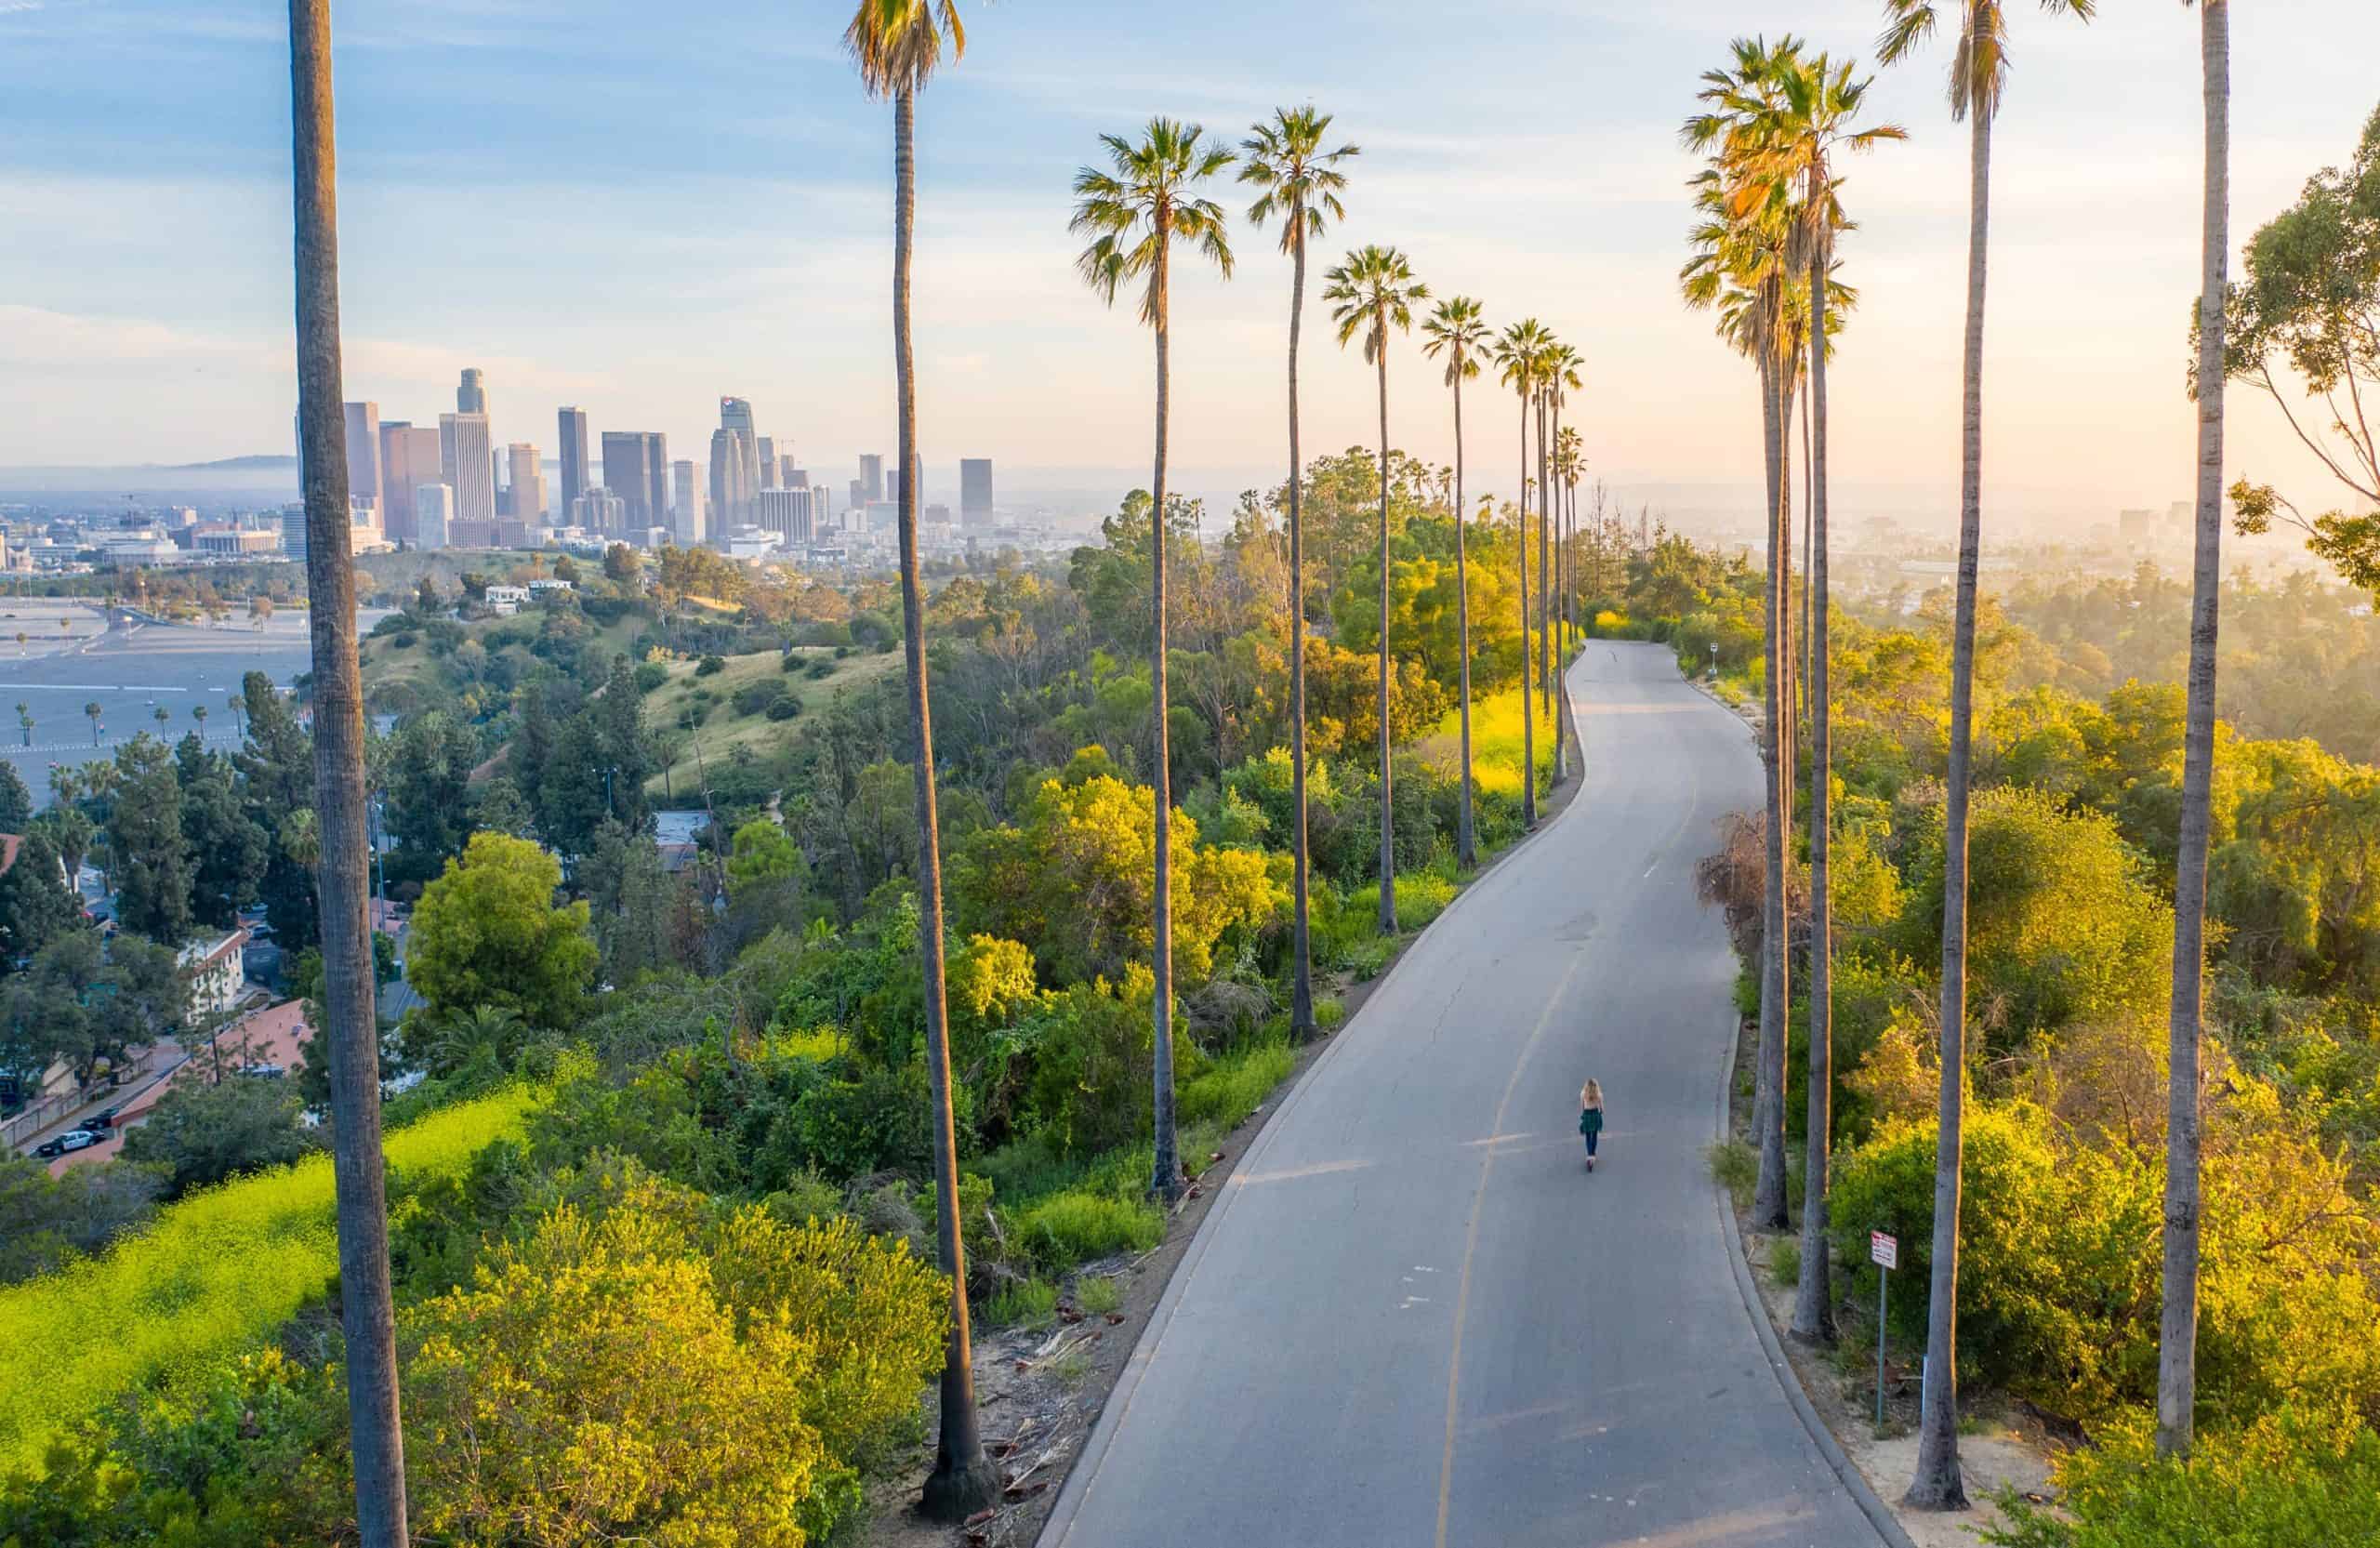
1. East 5th Street and South Sand Pedro Street (Los Angeles)
- Neighborhood: Bordered by E. 5th St., S. Los Angeles St., Boyd St., and S. Sand Pedro St.
- Crime Rate: 347 per 1,000 residents
- Most Common Crime: Violent or Property Crime
- Total Crime Rate: 239
LA has a population of 3.8 million, which is more than several entire states in the United States. With that many people in an area of about 502 square miles, there are bound to be a few crimes. There are a few neighborhoods with especially high rates, the biggest being the neighborhood block contained in S. Los Angeles St., Boyd St., S. San Pedro, and E. 5th Street. According to Neighborhood Scout, and the 5-Year American Community, this is the single most dangerous neighborhood in the United States.
This block group is unique in that 89% of the population is comprised of males, 80% of the population is unemployed, and the average household income is less than $10,000. In fact, 99.98% of all neighborhoods in America have higher median household incomes. Poverty, lack of resources, lack of education, businesses, and grocery stores breed desperation, which often results in high crime.
The image featured at the top of this post is ©Bastiaan Slabbers / iStock Unreleased via Getty Images