


The Price of Gas the Year You Were Born (1922 to 2020)
Gasoline prices have long been an important indicator of inflation and economic trends in the United States. Because fuel costs affect transportation, shipping, and everyday travel, changes at the pump can quickly influence the overall cost of living.
For this slideshow, History Computer reviewed historical gasoline price data from the U.S. Department of Energy’s Energy Efficiency & Renewable Energy division and the U.S. Energy Information Administration to determine the average cost of a gallon of gas for each year. Data from 1929 through the early 1990s comes from historical pump price reports, while more recent figures come from the Energy Information Administration’s annual gas price records.
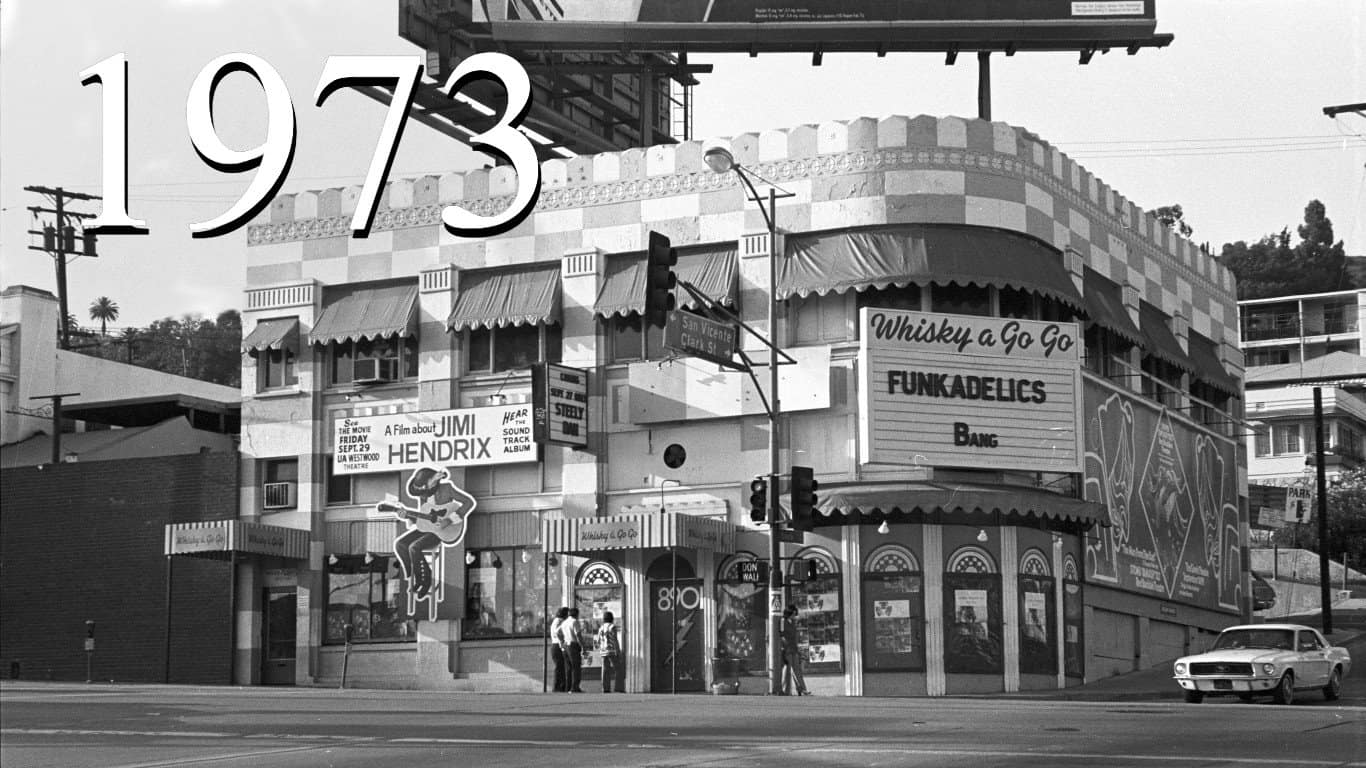
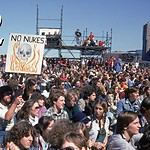
Americans began paying much closer attention to fuel prices during the 1973 to 1974 Arab oil embargo, when gasoline prices jumped dramatically and shortages led to rationing in many states. Since then, gas prices have continued to fluctuate with global events, oil production, and market conditions, occasionally reaching record highs during periods of supply disruption or strong demand.
1929
> Avg. U.S. gas prices per gallon (inflation adj.): $0.21 ($3.59 -- #23 highest since 1929)
> U.S. gas consumption: N/A
> Per capita gas consumption: N/A
> Price of a barrel of oil (inflation adj.): $1.30 ($21.74 -- #81 highest since 1929)
> U.S. oil production: 1.0 billion barrels -- #88 most since 1929
1930
> Avg. U.S. gas prices per gallon (inflation adj.): $0.20 ($3.50 -- #26 highest since 1929)
> U.S. gas consumption: N/A
> Per capita gas consumption: N/A
> Price of a barrel of oil (inflation adj.): $1.20 ($20.85 -- #86 highest since 1929)
> U.S. oil production: 898.0 million barrels -- #92 most since 1929
1931
> Avg. U.S. gas prices per gallon (inflation adj.): $0.17 ($3.27 -- #37 highest since 1929)
> U.S. gas consumption: N/A
> Per capita gas consumption: N/A
> Price of a barrel of oil (inflation adj.): $0.70 ($12.51 -- #94 highest since 1929)
> U.S. oil production: 851.1 million barrels -- #93 most since 1929
1932
> Avg. U.S. gas prices per gallon (inflation adj.): $0.18 ($3.85 -- #17 highest since 1929)
> U.S. gas consumption: N/A
> Per capita gas consumption: N/A
> Price of a barrel of oil (inflation adj.): $0.90 ($18.58 -- #92 highest since 1929)
> U.S. oil production: 785.2 million barrels -- #94 most since 1929
1933
> Avg. U.S. gas prices per gallon (inflation adj.): $0.18 ($4.05 -- #13 highest since 1929)
> U.S. gas consumption: N/A
> Per capita gas consumption: N/A
> Price of a barrel of oil (inflation adj.): $0.70 ($15.08 -- #93 highest since 1929)
> U.S. oil production: 905.7 million barrels -- #91 most since 1929
1934
> Avg. U.S. gas prices per gallon (inflation adj.): $0.19 ($4.15 -- #9 highest since 1929)
> U.S. gas consumption: N/A
> Per capita gas consumption: N/A
> Price of a barrel of oil (inflation adj.): $1.00 ($21.84 -- #80 highest since 1929)
> U.S. oil production: 908.1 million barrels -- #90 most since 1929
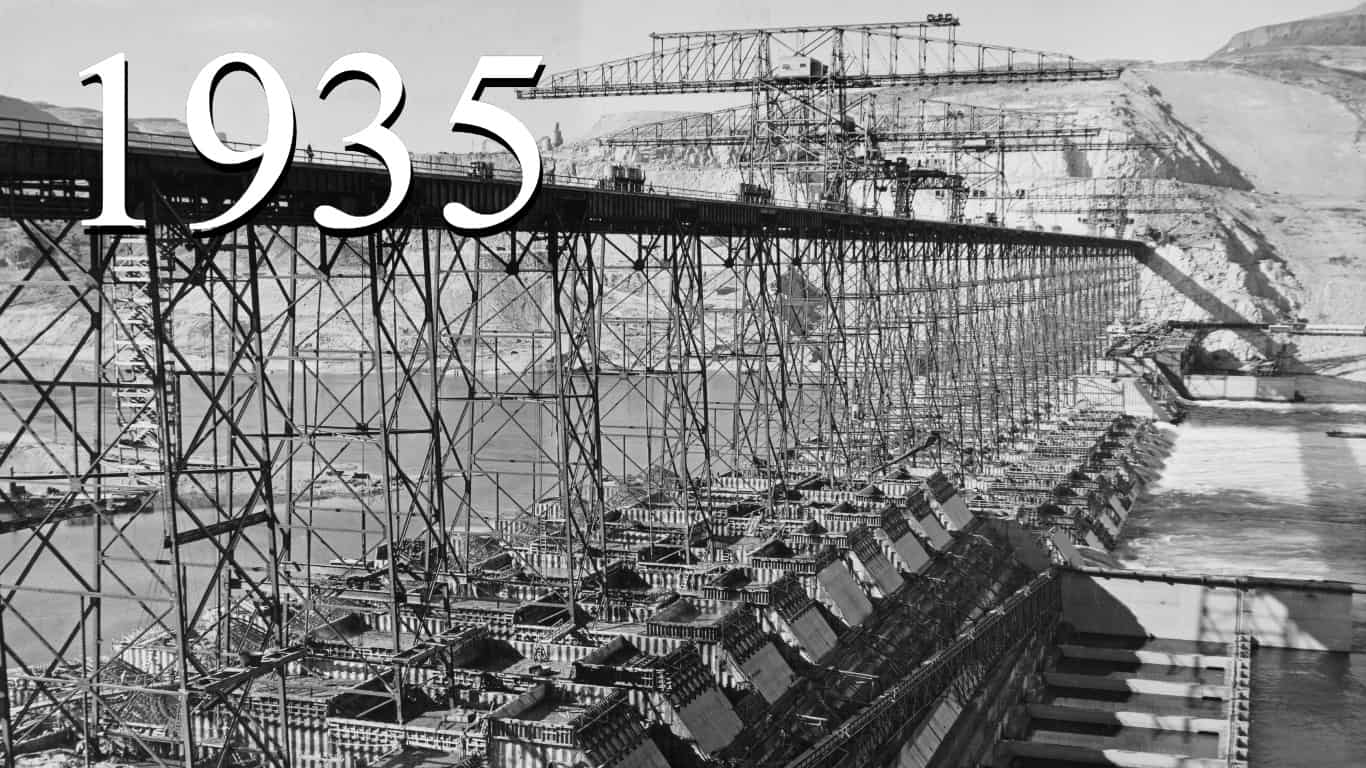
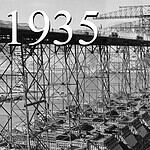
1935
> Avg. U.S. gas prices per gallon (inflation adj.): $0.19 ($4.06 -- #12 highest since 1929)
> U.S. gas consumption: N/A
> Per capita gas consumption: N/A
> Price of a barrel of oil (inflation adj.): $1.00 ($20.72 -- #87 highest since 1929)
> U.S. oil production: 993.9 million barrels -- #89 most since 1929
1936
> Avg. U.S. gas prices per gallon (inflation adj.): $0.19 ($4.00 -- #15 highest since 1929)
> U.S. gas consumption: N/A
> Per capita gas consumption: N/A
> Price of a barrel of oil (inflation adj.): $1.10 ($22.95 -- #78 highest since 1929)
> U.S. oil production: 1.1 billion barrels -- #87 most since 1929
1937
> Avg. U.S. gas prices per gallon (inflation adj.): $0.20 ($4.06 -- #10 highest since 1929)
> U.S. gas consumption: N/A
> Per capita gas consumption: N/A
> Price of a barrel of oil (inflation adj.): $1.20 ($23.98 -- #75 highest since 1929)
> U.S. oil production: 1.3 billion barrels -- #84 most since 1929
1938
> Avg. U.S. gas prices per gallon (inflation adj.): $0.20 ($4.15 -- #8 highest since 1929)
> U.S. gas consumption: N/A
> Per capita gas consumption: N/A
> Price of a barrel of oil (inflation adj.): $1.10 ($23.45 -- #77 highest since 1929)
> U.S. oil production: 1.2 billion barrels -- #86 most since 1929
1939
> Avg. U.S. gas prices per gallon (inflation adj.): $0.19 ($4.00 -- #15 highest since 1929)
> U.S. gas consumption: N/A
> Per capita gas consumption: N/A
> Price of a barrel of oil (inflation adj.): $1.00 ($21.48 -- #82 highest since 1929)
> U.S. oil production: 1.3 billion barrels -- #85 most since 1929
1940
> Avg. U.S. gas prices per gallon (inflation adj.): $0.18 ($3.76 -- #21 highest since 1929)
> U.S. gas consumption: N/A
> Per capita gas consumption: N/A
> Price of a barrel of oil (inflation adj.): $1.00 ($21.32 -- #84 highest since 1929)
> U.S. oil production: 1.5 billion barrels -- #81 most since 1929
1941
> Avg. U.S. gas prices per gallon (inflation adj.): $0.19 ($3.78 -- #20 highest since 1929)
> U.S. gas consumption: N/A
> Per capita gas consumption: N/A
> Price of a barrel of oil (inflation adj.): $1.10 ($22.70 -- #79 highest since 1929)
> U.S. oil production: 1.4 billion barrels -- #82 most since 1929
1942
> Avg. U.S. gas prices per gallon (inflation adj.): $0.20 ($3.59 -- #24 highest since 1929)
> U.S. gas consumption: N/A
> Per capita gas consumption: N/A
> Price of a barrel of oil (inflation adj.): $1.20 ($21.37 -- #83 highest since 1929)
> U.S. oil production: 1.4 billion barrels -- #83 most since 1929
1943
> Avg. U.S. gas prices per gallon (inflation adj.): $0.21 ($3.55 -- #25 highest since 1929)
> U.S. gas consumption: N/A
> Per capita gas consumption: N/A
> Price of a barrel of oil (inflation adj.): $1.20 ($20.30 -- #88 highest since 1929)
> U.S. oil production: 1.5 billion barrels -- #80 most since 1929
1944
> Avg. U.S. gas prices per gallon (inflation adj.): $0.21 ($3.49 -- #27 highest since 1929)
> U.S. gas consumption: N/A
> Per capita gas consumption: N/A
> Price of a barrel of oil (inflation adj.): $1.20 ($20.12 -- #89 highest since 1929)
> U.S. oil production: 1.7 billion barrels -- #79 most since 1929
1945
> Avg. U.S. gas prices per gallon (inflation adj.): $0.21 ($3.41 -- #30 highest since 1929)
> U.S. gas consumption: 24.3 billion gallons -- #78 most since 1945
> Per capita gas consumption: 173.9 gallons -- #78 most since 1945
> Price of a barrel of oil (inflation adj.): $1.20 ($19.84 -- #90 highest since 1929)
> U.S. oil production: 1.7 billion barrels -- #78 most since 1929
1946
> Avg. U.S. gas prices per gallon (inflation adj.): $0.21 ($3.15 -- #45 highest since 1929)
> U.S. gas consumption: 30.3 billion gallons -- #77 most since 1945
> Per capita gas consumption: 214.6 gallons -- #77 most since 1945
> Price of a barrel of oil (inflation adj.): $1.40 ($21.16 -- #85 highest since 1929)
> U.S. oil production: 1.7 billion barrels -- #77 most since 1929
1947
> Avg. U.S. gas prices per gallon (inflation adj.): $0.23 ($3.02 -- #57 highest since 1929)
> U.S. gas consumption: 32.5 billion gallons -- #76 most since 1945
> Per capita gas consumption: 225.4 gallons -- #76 most since 1945
> Price of a barrel of oil (inflation adj.): $1.90 ($25.33 -- #70 highest since 1929)
> U.S. oil production: 1.9 billion barrels -- #72 most since 1929
1948
> Avg. U.S. gas prices per gallon (inflation adj.): $0.26 ($3.16 -- #43 highest since 1929)
> U.S. gas consumption: 35.1 billion gallons -- #75 most since 1945
> Per capita gas consumption: 239 gallons -- #75 most since 1945
> Price of a barrel of oil (inflation adj.): $2.60 ($31.57 -- #44 highest since 1929)
> U.S. oil production: 2.0 billion barrels -- #66 most since 1929
1949
> Avg. U.S. gas prices per gallon (inflation adj.): $0.27 ($3.32 -- #33 highest since 1929)
> U.S. gas consumption: 36.9 billion gallons -- #74 most since 1945
> Per capita gas consumption: 247.7 gallons -- #74 most since 1945
> Price of a barrel of oil (inflation adj.): $2.50 ($31.23 -- #46 highest since 1929)
> U.S. oil production: 1.8 billion barrels -- #75 most since 1929
1950
> Avg. U.S. gas prices per gallon (inflation adj.): $0.27 ($3.28 -- #35 highest since 1929)
> U.S. gas consumption: 40.1 billion gallons -- #73 most since 1945
> Per capita gas consumption: 263.3 gallons -- #73 most since 1945
> Price of a barrel of oil (inflation adj.): $2.50 ($30.48 -- #49 highest since 1929)
> U.S. oil production: 2.0 billion barrels -- #69 most since 1929
1951
> Avg. U.S. gas prices per gallon (inflation adj.): $0.27 ($3.04 -- #53 highest since 1929)
> U.S. gas consumption: 45.8 billion gallons -- #71 most since 1945
> Per capita gas consumption: 295.5 gallons -- #71 most since 1945
> Price of a barrel of oil (inflation adj.): $2.50 ($28.48 -- #56 highest since 1929)
> U.S. oil production: 2.2 billion barrels -- #59 most since 1929
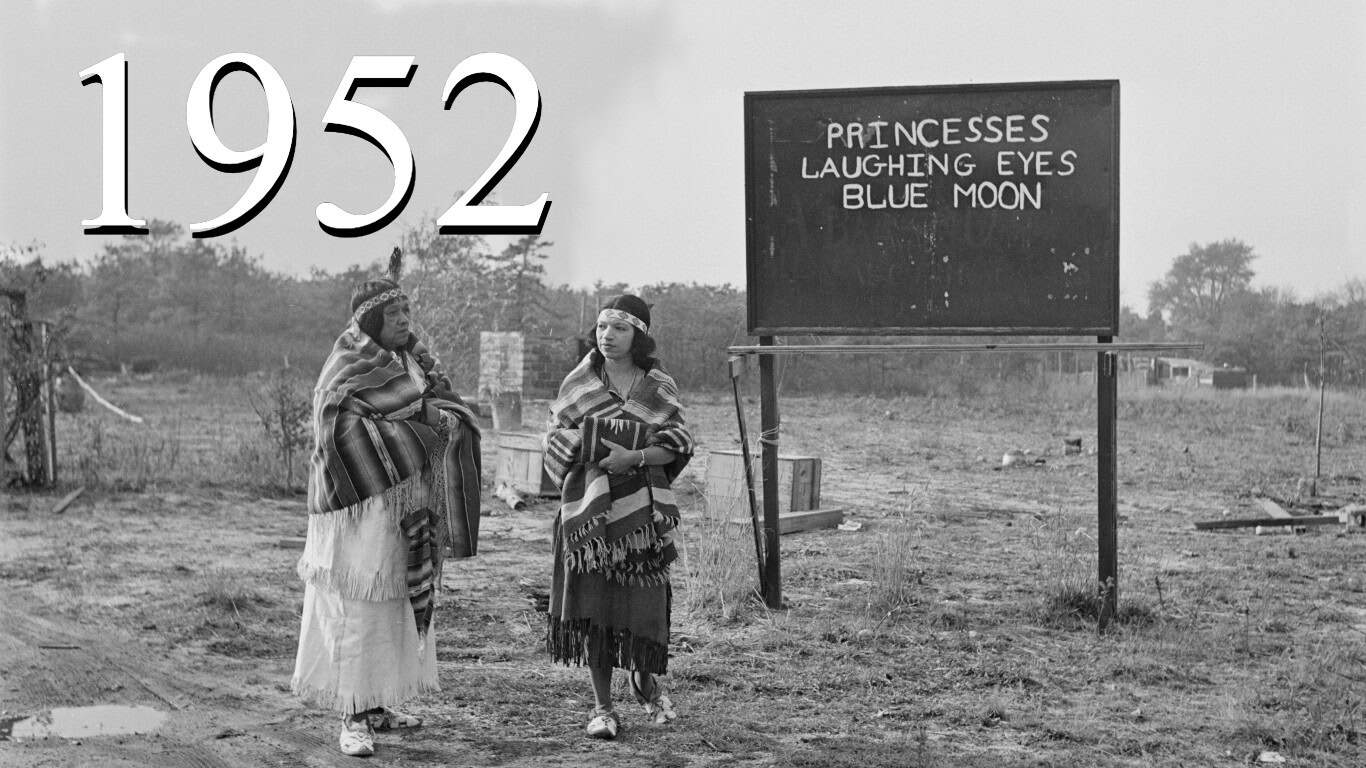
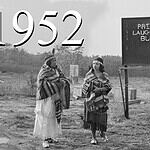
1952
> Avg. U.S. gas prices per gallon (inflation adj.): $0.27 ($2.98 -- #61 highest since 1929)
> U.S. gas consumption: 45.4 billion gallons -- #72 most since 1945
> Per capita gas consumption: 288.2 gallons -- #72 most since 1945
> Price of a barrel of oil (inflation adj.): $2.50 ($27.94 -- #61 highest since 1929)
> U.S. oil production: 2.3 billion barrels -- #57 most since 1929
1953
> Avg. U.S. gas prices per gallon (inflation adj.): $0.29 ($3.18 -- #41 highest since 1929)
> U.S. gas consumption: 47.7 billion gallons -- #70 most since 1945
> Per capita gas consumption: 297.6 gallons -- #70 most since 1945
> Price of a barrel of oil (inflation adj.): $2.70 ($29.38 -- #53 highest since 1929)
> U.S. oil production: 2.4 billion barrels -- #54 most since 1929
1954
> Avg. U.S. gas prices per gallon (inflation adj.): $0.29 ($3.16 -- #44 highest since 1929)
> U.S. gas consumption: 49.0 billion gallons -- #69 most since 1945
> Per capita gas consumption: 300.3 gallons -- #69 most since 1945
> Price of a barrel of oil (inflation adj.): $2.80 ($30.24 -- #51 highest since 1929)
> U.S. oil production: 2.3 billion barrels -- #56 most since 1929
1955
> Avg. U.S. gas prices per gallon (inflation adj.): $0.29 ($3.17 -- #42 highest since 1929)
> U.S. gas consumption: 53.1 billion gallons -- #68 most since 1945
> Per capita gas consumption: 320 gallons -- #68 most since 1945
> Price of a barrel of oil (inflation adj.): $2.80 ($30.25 -- #50 highest since 1929)
> U.S. oil production: 2.5 billion barrels -- #48 most since 1929
1956
> Avg. U.S. gas prices per gallon (inflation adj.): $0.30 ($3.23 -- #39 highest since 1929)
> U.S. gas consumption: 54.5 billion gallons -- #67 most since 1945
> Per capita gas consumption: 322.9 gallons -- #66 most since 1945
> Price of a barrel of oil (inflation adj.): $2.80 ($30.02 -- #52 highest since 1929)
> U.S. oil production: 2.6 billion barrels -- #43 most since 1929
1957
> Avg. U.S. gas prices per gallon (inflation adj.): $0.31 ($3.23 -- #38 highest since 1929)
> U.S. gas consumption: 55.4 billion gallons -- #66 most since 1945
> Per capita gas consumption: 322.2 gallons -- #67 most since 1945
> Price of a barrel of oil (inflation adj.): $3.10 ($32.18 -- #43 highest since 1929)
> U.S. oil production: 2.6 billion barrels -- #44 most since 1929
1958
> Avg. U.S. gas prices per gallon (inflation adj.): $0.30 ($3.04 -- #54 highest since 1929)
> U.S. gas consumption: 56.9 billion gallons -- #65 most since 1945
> Per capita gas consumption: 325.3 gallons -- #65 most since 1945
> Price of a barrel of oil (inflation adj.): $3.00 ($30.48 -- #48 highest since 1929)
> U.S. oil production: 2.4 billion barrels -- #49 most since 1929
1959
> Avg. U.S. gas prices per gallon (inflation adj.): $0.31 ($3.12 -- #47 highest since 1929)
> U.S. gas consumption: 59.2 billion gallons -- #64 most since 1945
> Per capita gas consumption: 332.7 gallons -- #64 most since 1945
> Price of a barrel of oil (inflation adj.): $2.90 ($29.16 -- #54 highest since 1929)
> U.S. oil production: 2.6 billion barrels -- #46 most since 1929
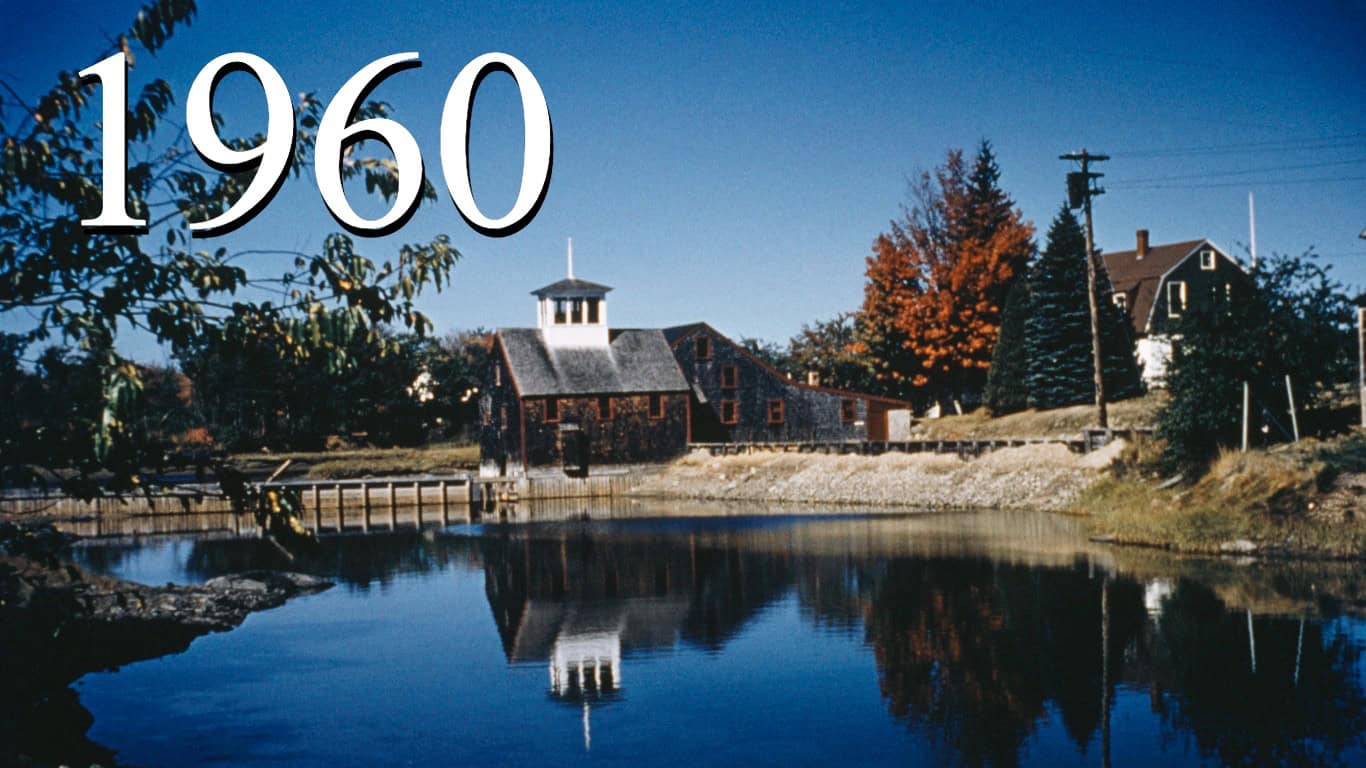
1960
> Avg. U.S. gas prices per gallon (inflation adj.): $0.31 ($3.06 -- #51 highest since 1929)
> U.S. gas consumption: 61.0 billion gallons -- #63 most since 1945
> Per capita gas consumption: 337.7 gallons -- #62 most since 1945
> Price of a barrel of oil (inflation adj.): $2.90 ($28.47 -- #57 highest since 1929)
> U.S. oil production: 2.6 billion barrels -- #45 most since 1929
1961
> Avg. U.S. gas prices per gallon (inflation adj.): $0.31 ($3.03 -- #56 highest since 1929)
> U.S. gas consumption: 62.0 billion gallons -- #62 most since 1945
> Per capita gas consumption: 337.4 gallons -- #63 most since 1945
> Price of a barrel of oil (inflation adj.): $2.90 ($28.29 -- #58 highest since 1929)
> U.S. oil production: 2.6 billion barrels -- #42 most since 1929
1962
> Avg. U.S. gas prices per gallon (inflation adj.): $0.31 ($3.00 -- #59 highest since 1929)
> U.S. gas consumption: 64.4 billion gallons -- #61 most since 1945
> Per capita gas consumption: 345.1 gallons -- #61 most since 1945
> Price of a barrel of oil (inflation adj.): $2.90 ($28.10 -- #59 highest since 1929)
> U.S. oil production: 2.7 billion barrels -- #40 most since 1929
1963
> Avg. U.S. gas prices per gallon (inflation adj.): $0.30 ($2.87 -- #66 highest since 1929)
> U.S. gas consumption: 66.4 billion gallons -- #60 most since 1945
> Per capita gas consumption: 351.1 gallons -- #60 most since 1945
> Price of a barrel of oil (inflation adj.): $2.90 ($27.64 -- #62 highest since 1929)
> U.S. oil production: 2.8 billion barrels -- #36 most since 1929
1964
> Avg. U.S. gas prices per gallon (inflation adj.): $0.30 ($2.83 -- #68 highest since 1929)
> U.S. gas consumption: 67.7 billion gallons -- #59 most since 1945
> Per capita gas consumption: 352.7 gallons -- #59 most since 1945
> Price of a barrel of oil (inflation adj.): $2.90 ($27.19 -- #64 highest since 1929)
> U.S. oil production: 2.8 billion barrels -- #34 most since 1929
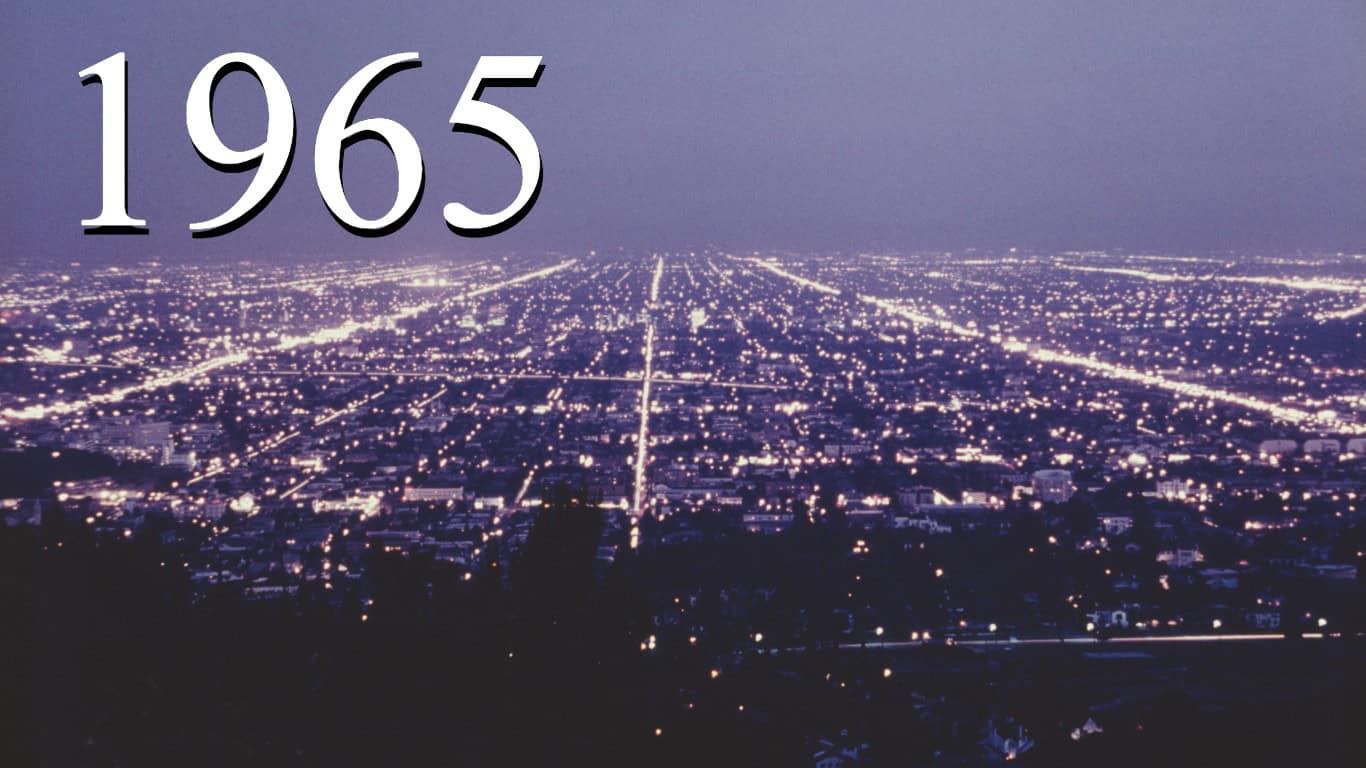
1965
> Avg. U.S. gas prices per gallon (inflation adj.): $0.31 ($2.88 -- #65 highest since 1929)
> U.S. gas consumption: 70.4 billion gallons -- #58 most since 1945
> Per capita gas consumption: 362.3 gallons -- #58 most since 1945
> Price of a barrel of oil (inflation adj.): $2.90 ($26.57 -- #65 highest since 1929)
> U.S. oil production: 2.8 billion barrels -- #33 most since 1929
1966
> Avg. U.S. gas prices per gallon (inflation adj.): $0.32 ($2.89 -- #64 highest since 1929)
> U.S. gas consumption: 73.7 billion gallons -- #57 most since 1945
> Per capita gas consumption: 375 gallons -- #56 most since 1945
> Price of a barrel of oil (inflation adj.): $2.90 ($26.01 -- #67 highest since 1929)
> U.S. oil production: 3.0 billion barrels -- #29 most since 1929
1967
> Avg. U.S. gas prices per gallon (inflation adj.): $0.33 ($2.89 -- #63 highest since 1929)
> U.S. gas consumption: 76.0 billion gallons -- #56 most since 1945
> Per capita gas consumption: 382.5 gallons -- #55 most since 1945
> Price of a barrel of oil (inflation adj.): $2.90 ($25.59 -- #69 highest since 1929)
> U.S. oil production: 3.2 billion barrels -- #17 most since 1929
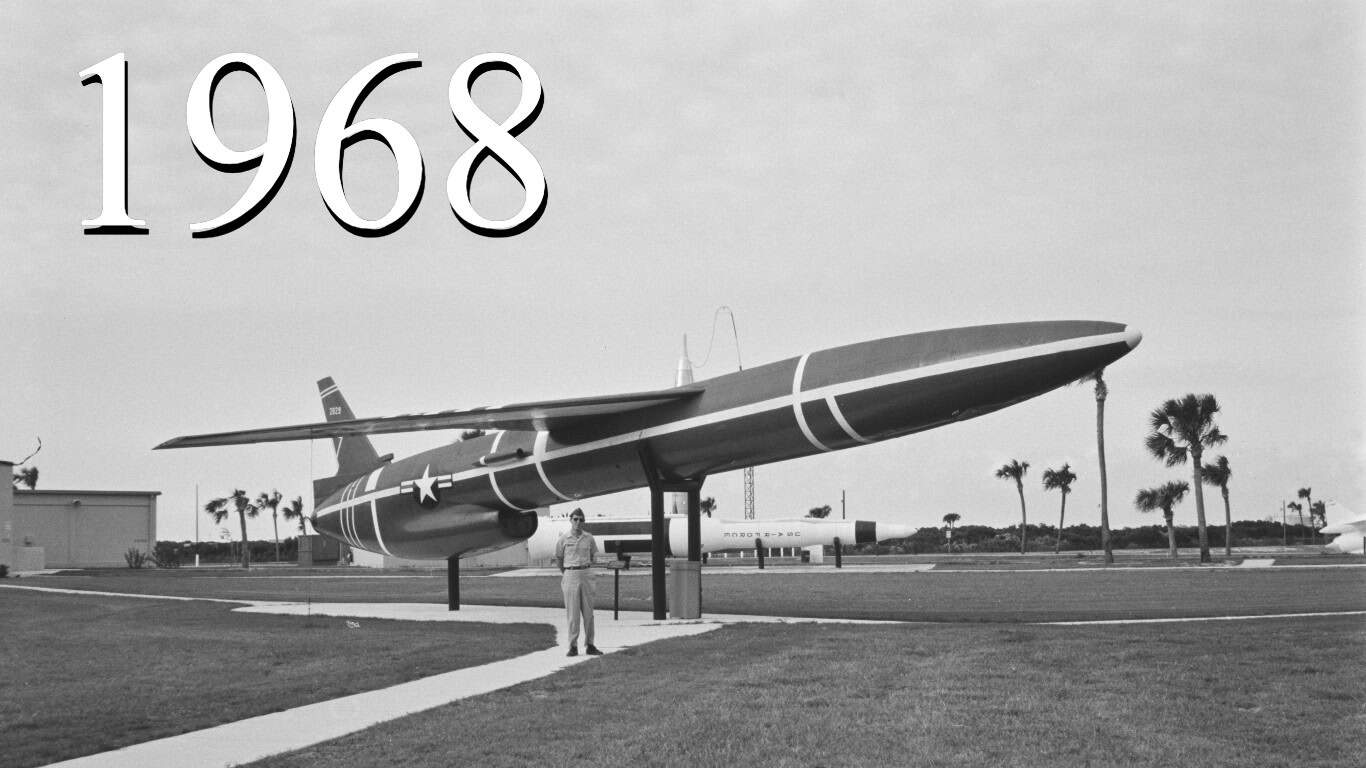
1968
> Avg. U.S. gas prices per gallon (inflation adj.): $0.34 ($2.86 -- #67 highest since 1929)
> U.S. gas consumption: 80.9 billion gallons -- #55 most since 1945
> Per capita gas consumption: 402.9 gallons -- #54 most since 1945
> Price of a barrel of oil (inflation adj.): $2.90 ($24.72 -- #71 highest since 1929)
> U.S. oil production: 3.3 billion barrels -- #13 most since 1929
1969
> Avg. U.S. gas prices per gallon (inflation adj.): $0.35 ($2.79 -- #70 highest since 1929)
> U.S. gas consumption: 84.7 billion gallons -- #54 most since 1945
> Per capita gas consumption: 418 gallons -- #51 most since 1945
> Price of a barrel of oil (inflation adj.): $3.10 ($24.64 -- #72 highest since 1929)
> U.S. oil production: 3.4 billion barrels -- #11 most since 1929
1970
> Avg. U.S. gas prices per gallon (inflation adj.): $0.36 ($2.72 -- #72 highest since 1929)
> U.S. gas consumption: 88.7 billion gallons -- #53 most since 1945
> Per capita gas consumption: 432.5 gallons -- #46 most since 1945
> Price of a barrel of oil (inflation adj.): $3.20 ($23.99 -- #74 highest since 1929)
> U.S. oil production: 3.5 billion barrels -- #6 most since 1929
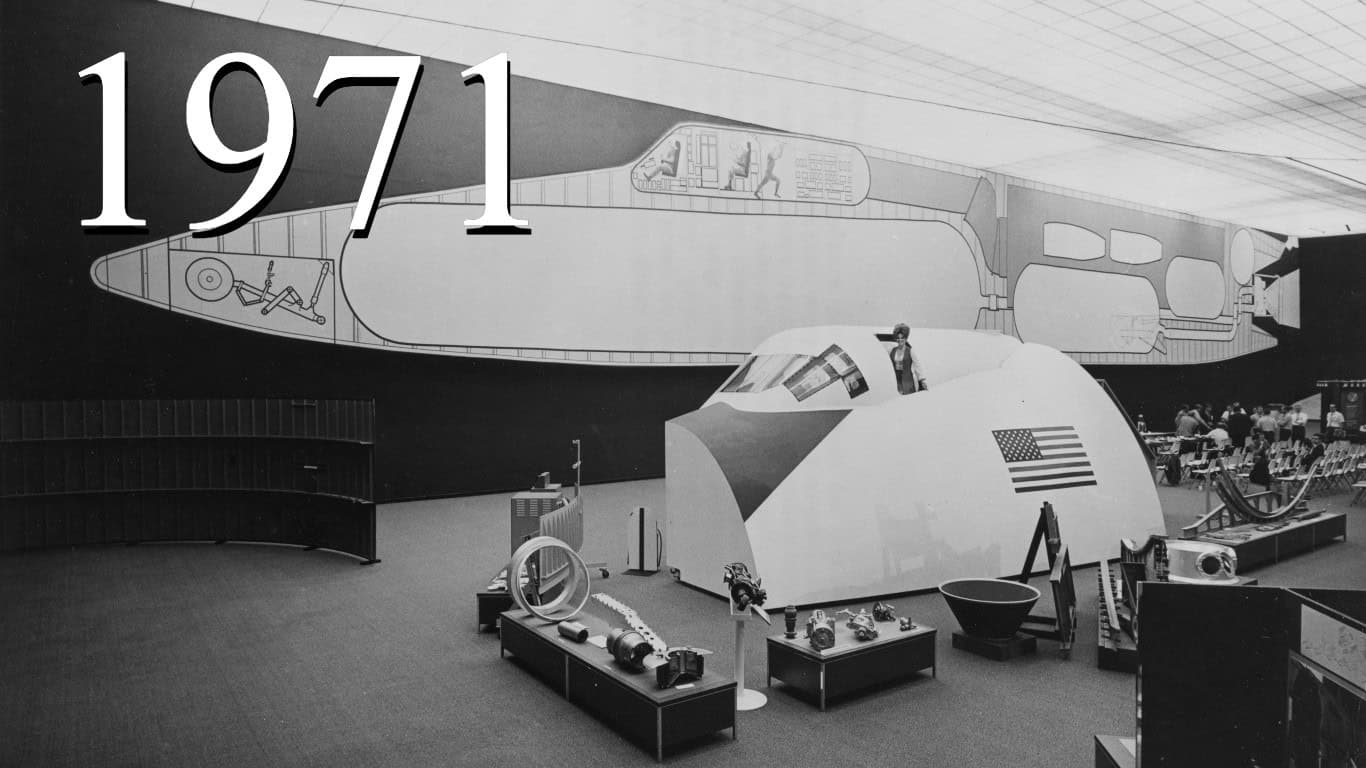
1971
> Avg. U.S. gas prices per gallon (inflation adj.): $0.36 ($2.60 -- #73 highest since 1929)
> U.S. gas consumption: 92.2 billion gallons -- #52 most since 1945
> Per capita gas consumption: 444 gallons -- #33 most since 1945
> Price of a barrel of oil (inflation adj.): $3.40 ($24.50 -- #73 highest since 1929)
> U.S. oil production: 3.5 billion barrels -- #8 most since 1929
1972
> Avg. U.S. gas prices per gallon (inflation adj.): $0.36 ($2.52 -- #79 highest since 1929)
> U.S. gas consumption: 98.0 billion gallons -- #51 most since 1945
> Per capita gas consumption: 467 gallons -- #16 most since 1945
> Price of a barrel of oil (inflation adj.): $3.40 ($23.73 -- #76 highest since 1929)
> U.S. oil production: 3.5 billion barrels -- #7 most since 1929
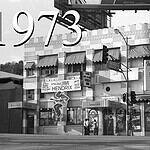
1973
> Avg. U.S. gas prices per gallon (inflation adj.): $0.39 ($2.57 -- #76 highest since 1929)
> U.S. gas consumption: 102.3 billion gallons -- #45 most since 1945
> Per capita gas consumption: 482.8 gallons -- #4 most since 1945
> Price of a barrel of oil (inflation adj.): $3.90 ($25.64 -- #68 highest since 1929)
> U.S. oil production: 3.4 billion barrels -- #12 most since 1929
1974
> Avg. U.S. gas prices per gallon (inflation adj.): $0.53 ($3.15 -- #46 highest since 1929)
> U.S. gas consumption: 100.2 billion gallons -- #50 most since 1945
> Per capita gas consumption: 468.6 gallons -- #14 most since 1945
> Price of a barrel of oil (inflation adj.): $6.90 ($40.78 -- #33 highest since 1929)
> U.S. oil production: 3.2 billion barrels -- #19 most since 1929
1975
> Avg. U.S. gas prices per gallon (inflation adj.): $0.57 ($3.10 -- #49 highest since 1929)
> U.S. gas consumption: 102.3 billion gallons -- #44 most since 1945
> Per capita gas consumption: 473.8 gallons -- #10 most since 1945
> Price of a barrel of oil (inflation adj.): $7.70 ($41.72 -- #30 highest since 1929)
> U.S. oil production: 3.1 billion barrels -- #27 most since 1929
1976
> Avg. U.S. gas prices per gallon (inflation adj.): $0.59 ($3.03 -- #55 highest since 1929)
> U.S. gas consumption: 107.3 billion gallons -- #41 most since 1945
> Per capita gas consumption: 491.9 gallons -- #3 most since 1945
> Price of a barrel of oil (inflation adj.): $8.20 ($42.12 -- #29 highest since 1929)
> U.S. oil production: 3.0 billion barrels -- #32 most since 1929
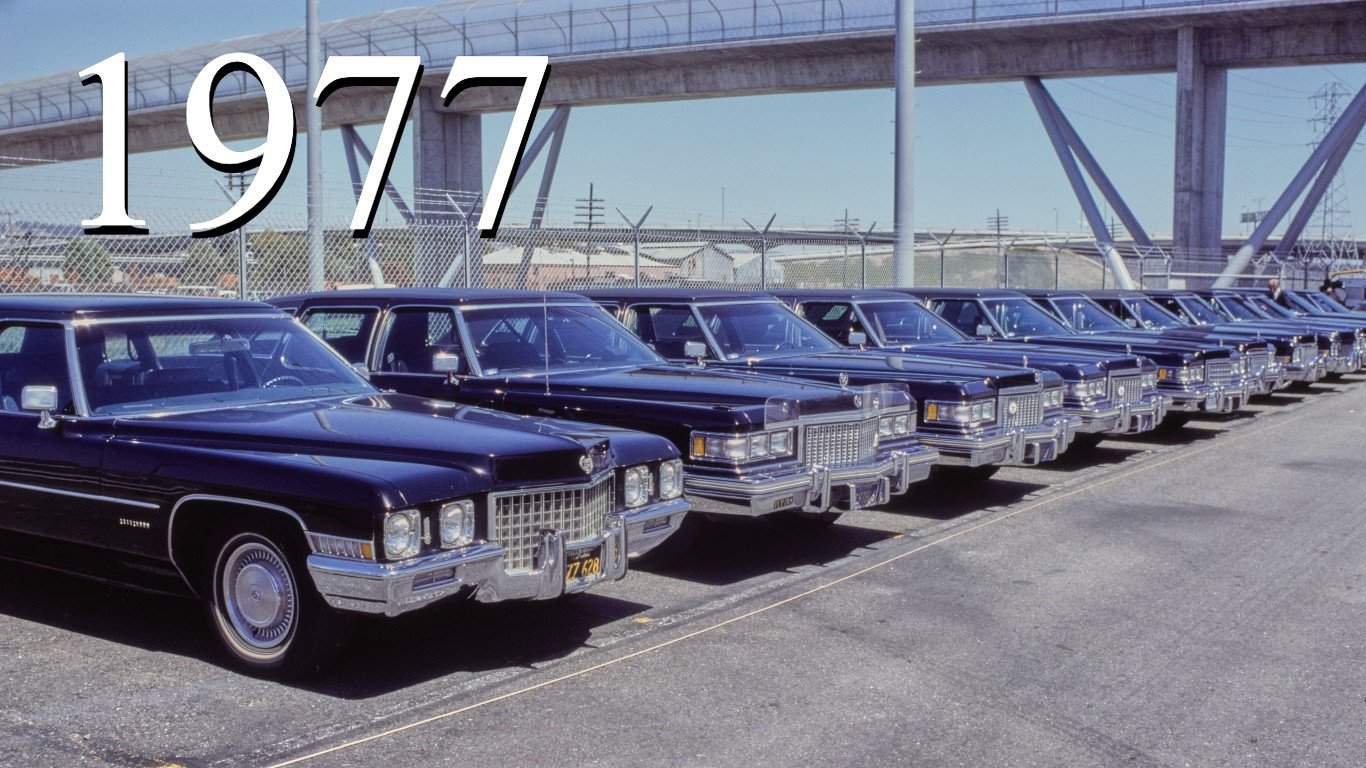
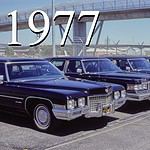
1977
> Avg. U.S. gas prices per gallon (inflation adj.): $0.62 ($2.99 -- #60 highest since 1929)
> U.S. gas consumption: 110.0 billion gallons -- #38 most since 1945
> Per capita gas consumption: 499.6 gallons -- #2 most since 1945
> Price of a barrel of oil (inflation adj.): $8.60 ($41.39 -- #32 highest since 1929)
> U.S. oil production: 3.0 billion barrels -- #30 most since 1929
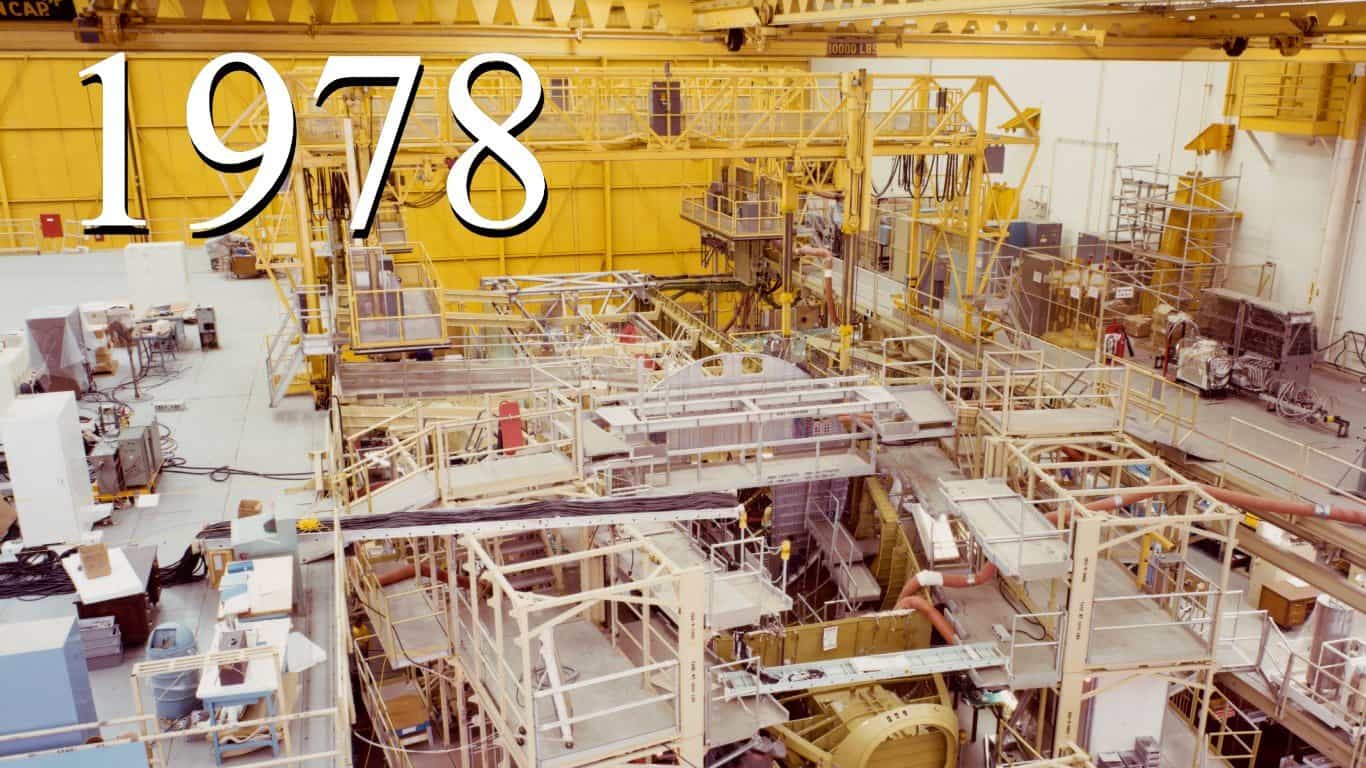
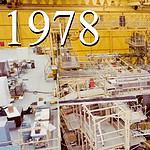
1978
> Avg. U.S. gas prices per gallon (inflation adj.): $0.63 ($2.83 -- #69 highest since 1929)
> U.S. gas consumption: 113.6 billion gallons -- #31 most since 1945
> Per capita gas consumption: 510.5 gallons -- #1 most since 1945
> Price of a barrel of oil (inflation adj.): $9.00 ($40.40 -- #34 highest since 1929)
> U.S. oil production: 3.2 billion barrels -- #20 most since 1929
1979
> Avg. U.S. gas prices per gallon (inflation adj.): $0.86 ($3.47 -- #29 highest since 1929)
> U.S. gas consumption: 107.8 billion gallons -- #39 most since 1945
> Per capita gas consumption: 479.2 gallons -- #5 most since 1945
> Price of a barrel of oil (inflation adj.): $12.60 ($50.95 -- #24 highest since 1929)
> U.S. oil production: 3.1 billion barrels -- #26 most since 1929
1980
> Avg. U.S. gas prices per gallon (inflation adj.): $1.19 ($4.23 -- #6 highest since 1929)
> U.S. gas consumption: 101.1 billion gallons -- #47 most since 1945
> Per capita gas consumption: 445 gallons -- #30 most since 1945
> Price of a barrel of oil (inflation adj.): $21.60 ($76.68 -- #14 highest since 1929)
> U.S. oil production: 3.1 billion barrels -- #24 most since 1929
1981
> Avg. U.S. gas prices per gallon (inflation adj.): $1.31 ($4.22 -- #7 highest since 1929)
> U.S. gas consumption: 101.0 billion gallons -- #48 most since 1945
> Per capita gas consumption: 440.1 gallons -- #36 most since 1945
> Price of a barrel of oil (inflation adj.): $31.80 ($102.28 -- #6 highest since 1929)
> U.S. oil production: 3.1 billion barrels -- #25 most since 1929
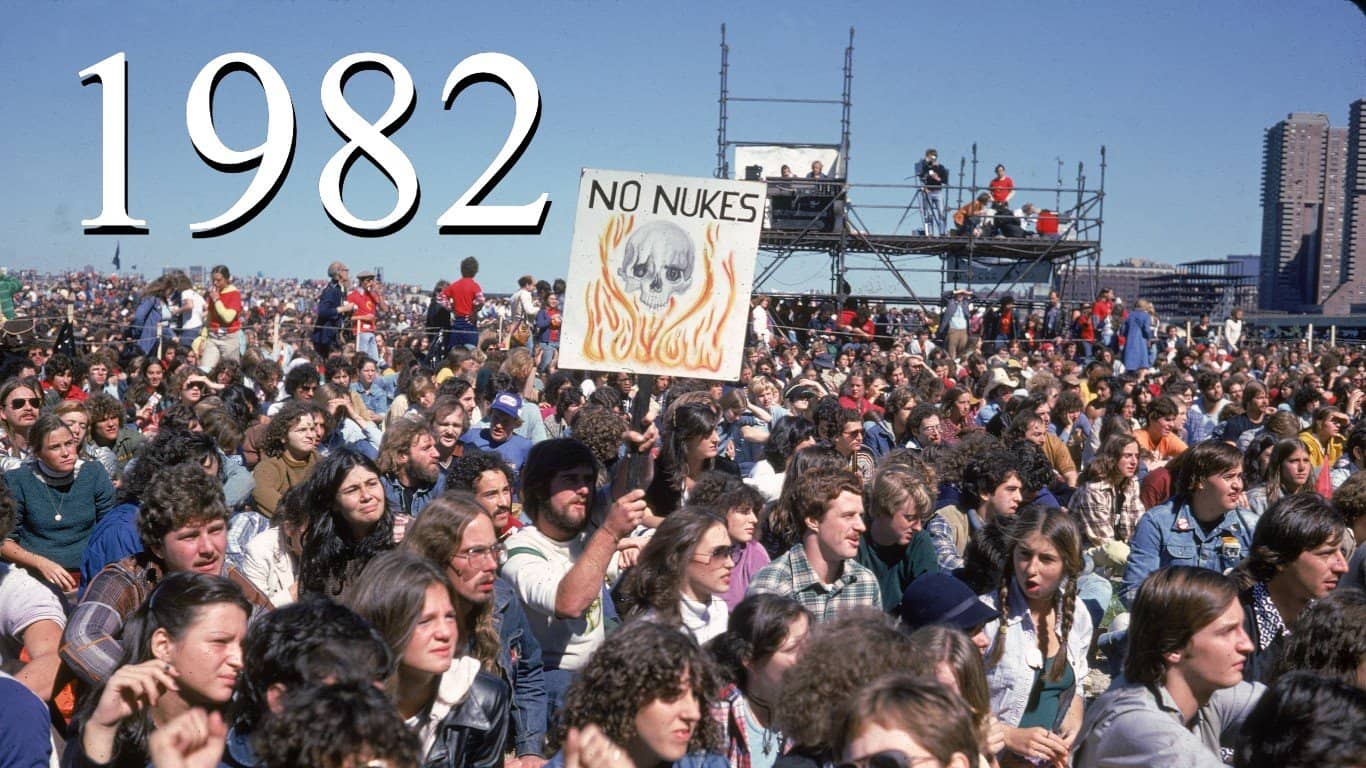
1982
> Avg. U.S. gas prices per gallon (inflation adj.): $1.22 ($3.70 -- #22 highest since 1929)
> U.S. gas consumption: 100.2 billion gallons -- #49 most since 1945
> Per capita gas consumption: 432.7 gallons -- #45 most since 1945
> Price of a barrel of oil (inflation adj.): $28.50 ($86.49 -- #11 highest since 1929)
> U.S. oil production: 3.2 billion barrels -- #23 most since 1929
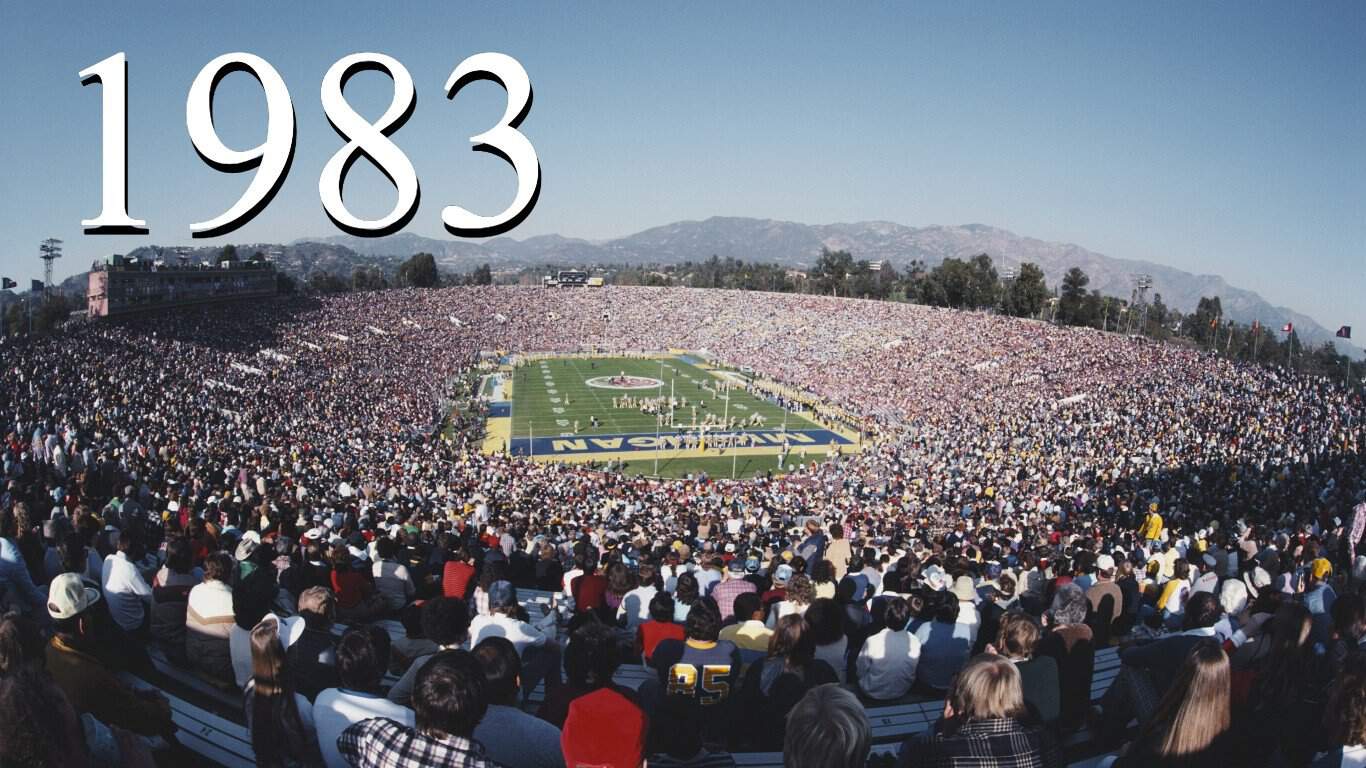
1983
> Avg. U.S. gas prices per gallon (inflation adj.): $1.16 ($3.41 -- #31 highest since 1929)
> U.S. gas consumption: 101.5 billion gallons -- #46 most since 1945
> Per capita gas consumption: 434.2 gallons -- #44 most since 1945
> Price of a barrel of oil (inflation adj.): $26.20 ($76.95 -- #12 highest since 1929)
> U.S. oil production: 3.2 billion barrels -- #21 most since 1929
1984
> Avg. U.S. gas prices per gallon (inflation adj.): $1.13 ($3.18 -- #40 highest since 1929)
> U.S. gas consumption: 102.9 billion gallons -- #43 most since 1945
> Per capita gas consumption: 436.2 gallons -- #42 most since 1945
> Price of a barrel of oil (inflation adj.): $25.90 ($72.90 -- #16 highest since 1929)
> U.S. oil production: 3.2 billion barrels -- #15 most since 1929
1985
> Avg. U.S. gas prices per gallon (inflation adj.): $1.12 ($3.05 -- #52 highest since 1929)
> U.S. gas consumption: 104.7 billion gallons -- #42 most since 1945
> Per capita gas consumption: 440.1 gallons -- #35 most since 1945
> Price of a barrel of oil (inflation adj.): $24.10 ($65.52 -- #19 highest since 1929)
> U.S. oil production: 3.3 billion barrels -- #14 most since 1929
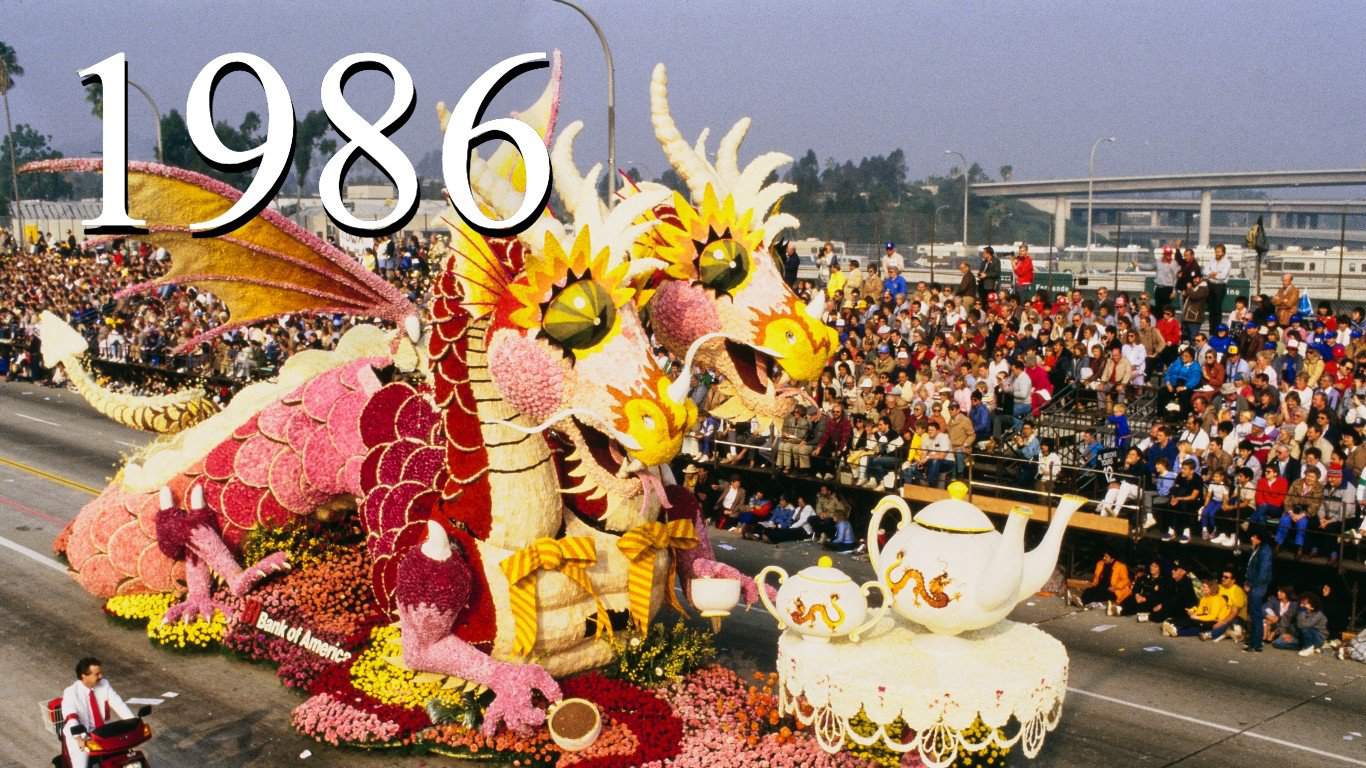
1986
> Avg. U.S. gas prices per gallon (inflation adj.): $0.86 ($2.30 -- #86 highest since 1929)
> U.S. gas consumption: 107.8 billion gallons -- #40 most since 1945
> Per capita gas consumption: 449.1 gallons -- #27 most since 1945
> Price of a barrel of oil (inflation adj.): $12.50 ($33.40 -- #41 highest since 1929)
> U.S. oil production: 3.2 billion barrels -- #22 most since 1929
1987
> Avg. U.S. gas prices per gallon (inflation adj.): $0.90 ($2.32 -- #85 highest since 1929)
> U.S. gas consumption: 110.5 billion gallons -- #36 most since 1945
> Per capita gas consumption: 455.9 gallons -- #22 most since 1945
> Price of a barrel of oil (inflation adj.): $15.40 ($39.67 -- #35 highest since 1929)
> U.S. oil production: 3.0 billion barrels -- #28 most since 1929
1988
> Avg. U.S. gas prices per gallon (inflation adj.): $0.90 ($2.23 -- #90 highest since 1929)
> U.S. gas consumption: 112.8 billion gallons -- #32 most since 1945
> Per capita gas consumption: 461.3 gallons -- #19 most since 1945
> Price of a barrel of oil (inflation adj.): $12.60 ($31.12 -- #47 highest since 1929)
> U.S. oil production: 3.0 billion barrels -- #31 most since 1929
1989
> Avg. U.S. gas prices per gallon (inflation adj.): $1.00 ($2.36 -- #82 highest since 1929)
> U.S. gas consumption: 112.3 billion gallons -- #33 most since 1945
> Per capita gas consumption: 455.1 gallons -- #23 most since 1945
> Price of a barrel of oil (inflation adj.): $15.90 ($37.43 -- #36 highest since 1929)
> U.S. oil production: 2.8 billion barrels -- #35 most since 1929
1990
> Avg. U.S. gas prices per gallon (inflation adj.): $1.15 ($2.58 -- #75 highest since 1929)
> U.S. gas consumption: 110.9 billion gallons -- #35 most since 1945
> Per capita gas consumption: 444.6 gallons -- #32 most since 1945
> Price of a barrel of oil (inflation adj.): $20.00 ($44.85 -- #27 highest since 1929)
> U.S. oil production: 2.7 billion barrels -- #39 most since 1929
1991
> Avg. U.S. gas prices per gallon (inflation adj.): $1.14 ($2.45 -- #80 highest since 1929)
> U.S. gas consumption: 110.2 billion gallons -- #37 most since 1945
> Per capita gas consumption: 437 gallons -- #41 most since 1945
> Price of a barrel of oil (inflation adj.): $16.50 ($35.54 -- #39 highest since 1929)
> U.S. oil production: 2.7 billion barrels -- #38 most since 1929
1992
> Avg. U.S. gas prices per gallon (inflation adj.): $1.13 ($2.36 -- #83 highest since 1929)
> U.S. gas consumption: 111.7 billion gallons -- #34 most since 1945
> Per capita gas consumption: 438.1 gallons -- #39 most since 1945
> Price of a barrel of oil (inflation adj.): $16.00 ($33.35 -- #42 highest since 1929)
> U.S. oil production: 2.6 billion barrels -- #41 most since 1929
1993
> Avg. U.S. gas prices per gallon (inflation adj.): $1.11 ($2.25 -- #89 highest since 1929)
> U.S. gas consumption: 114.6 billion gallons -- #30 most since 1945
> Per capita gas consumption: 444.6 gallons -- #31 most since 1945
> Price of a barrel of oil (inflation adj.): $14.30 ($28.86 -- #55 highest since 1929)
> U.S. oil production: 2.5 billion barrels -- #47 most since 1929
1994
> Avg. U.S. gas prices per gallon (inflation adj.): $1.08 ($2.13 -- #92 highest since 1929)
> U.S. gas consumption: 116.5 billion gallons -- #29 most since 1945
> Per capita gas consumption: 447.6 gallons -- #28 most since 1945
> Price of a barrel of oil (inflation adj.): $13.20 ($26.05 -- #66 highest since 1929)
> U.S. oil production: 2.4 billion barrels -- #50 most since 1929
1995
> Avg. U.S. gas prices per gallon (inflation adj.): $1.16 ($2.22 -- #91 highest since 1929)
> U.S. gas consumption: 119.4 billion gallons -- #28 most since 1945
> Per capita gas consumption: 454.3 gallons -- #25 most since 1945
> Price of a barrel of oil (inflation adj.): $14.60 ($28.07 -- #60 highest since 1929)
> U.S. oil production: 2.4 billion barrels -- #51 most since 1929
1996
> Avg. U.S. gas prices per gallon (inflation adj.): $1.25 ($2.32 -- #84 highest since 1929)
> U.S. gas consumption: 121.3 billion gallons -- #27 most since 1945
> Per capita gas consumption: 457.3 gallons -- #21 most since 1945
> Price of a barrel of oil (inflation adj.): $18.50 ($34.43 -- #40 highest since 1929)
> U.S. oil production: 2.4 billion barrels -- #53 most since 1929
1997
> Avg. U.S. gas prices per gallon (inflation adj.): $1.24 ($2.27 -- #87 highest since 1929)
> U.S. gas consumption: 122.9 billion gallons -- #26 most since 1945
> Per capita gas consumption: 458.9 gallons -- #20 most since 1945
> Price of a barrel of oil (inflation adj.): $17.20 ($31.42 -- #45 highest since 1929)
> U.S. oil production: 2.4 billion barrels -- #55 most since 1929
1998
> Avg. U.S. gas prices per gallon (inflation adj.): $1.07 ($1.92 -- #94 highest since 1929)
> U.S. gas consumption: 126.5 billion gallons -- #24 most since 1945
> Per capita gas consumption: 468.2 gallons -- #15 most since 1945
> Price of a barrel of oil (inflation adj.): $10.90 ($19.52 -- #91 highest since 1929)
> U.S. oil production: 2.3 billion barrels -- #58 most since 1929
1999
> Avg. U.S. gas prices per gallon (inflation adj.): $1.18 ($2.07 -- #93 highest since 1929)
> U.S. gas consumption: 129.2 billion gallons -- #23 most since 1945
> Per capita gas consumption: 474 gallons -- #9 most since 1945
> Price of a barrel of oil (inflation adj.): $15.60 ($27.33 -- #63 highest since 1929)
> U.S. oil production: 2.1 billion barrels -- #60 most since 1929
2000
> Avg. U.S. gas prices per gallon (inflation adj.): $1.52 ($2.59 -- #74 highest since 1929)
> U.S. gas consumption: 130.2 billion gallons -- #22 most since 1945
> Per capita gas consumption: 461.6 gallons -- #18 most since 1945
> Price of a barrel of oil (inflation adj.): $26.70 ($45.41 -- #26 highest since 1929)
> U.S. oil production: 2.1 billion barrels -- #61 most since 1929
2001
> Avg. U.S. gas prices per gallon (inflation adj.): $1.46 ($2.41 -- #81 highest since 1929)
> U.S. gas consumption: 132.0 billion gallons -- #21 most since 1945
> Per capita gas consumption: 463.2 gallons -- #17 most since 1945
> Price of a barrel of oil (inflation adj.): $21.80 ($36.09 -- #38 highest since 1929)
> U.S. oil production: 2.1 billion barrels -- #62 most since 1929
2002
> Avg. U.S. gas prices per gallon (inflation adj.): $1.39 ($2.25 -- #88 highest since 1929)
> U.S. gas consumption: 135.6 billion gallons -- #15 most since 1945
> Per capita gas consumption: 471.6 gallons -- #13 most since 1945
> Price of a barrel of oil (inflation adj.): $22.50 ($36.62 -- #37 highest since 1929)
> U.S. oil production: 2.1 billion barrels -- #63 most since 1929
2003
> Avg. U.S. gas prices per gallon (inflation adj.): $1.60 ($2.55 -- #78 highest since 1929)
> U.S. gas consumption: 137.0 billion gallons -- #13 most since 1945
> Per capita gas consumption: 472.1 gallons -- #12 most since 1945
> Price of a barrel of oil (inflation adj.): $27.60 ($43.83 -- #28 highest since 1929)
> U.S. oil production: 2.1 billion barrels -- #65 most since 1929
2004
> Avg. U.S. gas prices per gallon (inflation adj.): $1.90 ($2.94 -- #62 highest since 1929)
> U.S. gas consumption: 140.0 billion gallons -- #9 most since 1945
> Per capita gas consumption: 478 gallons -- #6 most since 1945
> Price of a barrel of oil (inflation adj.): $36.80 ($56.97 -- #22 highest since 1929)
> U.S. oil production: 2.0 billion barrels -- #68 most since 1929
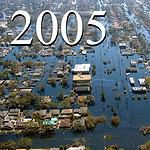
2005
> Avg. U.S. gas prices per gallon (inflation adj.): $2.31 ($3.47 -- #28 highest since 1929)
> U.S. gas consumption: 140.4 billion gallons -- #8 most since 1945
> Per capita gas consumption: 475.1 gallons -- #8 most since 1945
> Price of a barrel of oil (inflation adj.): $50.30 ($75.34 -- #15 highest since 1929)
> U.S. oil production: 1.9 billion barrels -- #71 most since 1929
2006
> Avg. U.S. gas prices per gallon (inflation adj.): $2.62 ($3.80 -- #19 highest since 1929)
> U.S. gas consumption: 141.8 billion gallons -- #6 most since 1945
> Per capita gas consumption: 475.4 gallons -- #7 most since 1945
> Price of a barrel of oil (inflation adj.): $59.70 ($86.65 -- #10 highest since 1929)
> U.S. oil production: 1.9 billion barrels -- #73 most since 1929
2007
> Avg. U.S. gas prices per gallon (inflation adj.): $2.84 ($4.01 -- #14 highest since 1929)
> U.S. gas consumption: 142.3 billion gallons -- #5 most since 1945
> Per capita gas consumption: 472.6 gallons -- #11 most since 1945
> Price of a barrel of oil (inflation adj.): $66.50 ($93.89 -- #9 highest since 1929)
> U.S. oil production: 1.9 billion barrels -- #74 most since 1929
2008
> Avg. U.S. gas prices per gallon (inflation adj.): $3.30 ($4.48 -- #4 highest since 1929)
> U.S. gas consumption: 138.2 billion gallons -- #10 most since 1945
> Per capita gas consumption: 454.4 gallons -- #24 most since 1945
> Price of a barrel of oil (inflation adj.): $94.00 ($127.83 -- #1 highest since 1929)
> U.S. oil production: 1.8 billion barrels -- #76 most since 1929
2009
> Avg. U.S. gas prices per gallon (inflation adj.): $2.41 ($3.28 -- #34 highest since 1929)
> U.S. gas consumption: 137.9 billion gallons -- #11 most since 1945
> Per capita gas consumption: 449.6 gallons -- #26 most since 1945
> Price of a barrel of oil (inflation adj.): $56.40 ($76.87 -- #13 highest since 1929)
> U.S. oil production: 2.0 billion barrels -- #70 most since 1929
2010
> Avg. U.S. gas prices per gallon (inflation adj.): $2.84 ($3.80 -- #18 highest since 1929)
> U.S. gas consumption: 137.9 billion gallons -- #12 most since 1945
> Per capita gas consumption: 445.7 gallons -- #29 most since 1945
> Price of a barrel of oil (inflation adj.): $74.70 ($100.27 -- #7 highest since 1929)
> U.S. oil production: 2.0 billion barrels -- #67 most since 1929
2011
> Avg. U.S. gas prices per gallon (inflation adj.): $3.58 ($4.65 -- #2 highest since 1929)
> U.S. gas consumption: 134.2 billion gallons -- #19 most since 1945
> Per capita gas consumption: 430.6 gallons -- #47 most since 1945
> Price of a barrel of oil (inflation adj.): $95.70 ($124.55 -- #2 highest since 1929)
> U.S. oil production: 2.1 billion barrels -- #64 most since 1929
2012
> Avg. U.S. gas prices per gallon (inflation adj.): $3.68 ($4.69 -- #1 highest since 1929)
> U.S. gas consumption: 133.5 billion gallons -- #20 most since 1945
> Per capita gas consumption: 425.2 gallons -- #50 most since 1945
> Price of a barrel of oil (inflation adj.): $94.50 ($120.48 -- #4 highest since 1929)
> U.S. oil production: 2.4 billion barrels -- #52 most since 1929
2013
> Avg. U.S. gas prices per gallon (inflation adj.): $3.58 ($4.49 -- #3 highest since 1929)
> U.S. gas consumption: 135.6 billion gallons -- #16 most since 1945
> Per capita gas consumption: 428.9 gallons -- #49 most since 1945
> Price of a barrel of oil (inflation adj.): $96.00 ($120.59 -- #3 highest since 1929)
> U.S. oil production: 2.7 billion barrels -- #37 most since 1929
2014
> Avg. U.S. gas prices per gallon (inflation adj.): $3.44 ($4.25 -- #5 highest since 1929)
> U.S. gas consumption: 136.8 billion gallons -- #14 most since 1945
> Per capita gas consumption: 429.5 gallons -- #48 most since 1945
> Price of a barrel of oil (inflation adj.): $87.40 ($108.03 -- #5 highest since 1929)
> U.S. oil production: 3.2 billion barrels -- #18 most since 1929
2015
> Avg. U.S. gas prices per gallon (inflation adj.): $2.52 ($3.11 -- #48 highest since 1929)
> U.S. gas consumption: 140.7 billion gallons -- #7 most since 1945
> Per capita gas consumption: 438.7 gallons -- #38 most since 1945
> Price of a barrel of oil (inflation adj.): $44.40 ($54.81 -- #23 highest since 1929)
> U.S. oil production: 3.4 billion barrels -- #9 most since 1929
2016
> Avg. U.S. gas prices per gallon (inflation adj.): $2.25 ($2.74 -- #71 highest since 1929)
> U.S. gas consumption: 143.2 billion gallons -- #1 most since 1945
> Per capita gas consumption: 443.3 gallons -- #34 most since 1945
> Price of a barrel of oil (inflation adj.): $38.30 ($46.69 -- #25 highest since 1929)
> U.S. oil production: 3.2 billion barrels -- #16 most since 1929
2017
> Avg. U.S. gas prices per gallon (inflation adj.): $2.53 ($3.02 -- #58 highest since 1929)
> U.S. gas consumption: 143.0 billion gallons -- #3 most since 1945
> Per capita gas consumption: 439.8 gallons -- #37 most since 1945
> Price of a barrel of oil (inflation adj.): $48.10 ($57.37 -- #21 highest since 1929)
> U.S. oil production: 3.4 billion barrels -- #10 most since 1929
2018
> Avg. U.S. gas prices per gallon (inflation adj.): $2.81 ($3.28 -- #36 highest since 1929)
> U.S. gas consumption: 143.0 billion gallons -- #2 most since 1945
> Per capita gas consumption: 437.6 gallons -- #40 most since 1945
> Price of a barrel of oil (inflation adj.): $61.40 ($71.56 -- #17 highest since 1929)
> U.S. oil production: 4.0 billion barrels -- #5 most since 1929
2019
> Avg. U.S. gas prices per gallon (inflation adj.): $2.69 ($3.08 -- #50 highest since 1929)
> U.S. gas consumption: 142.7 billion gallons -- #4 most since 1945
> Per capita gas consumption: 434.7 gallons -- #43 most since 1945
> Price of a barrel of oil (inflation adj.): $55.60 ($63.63 -- #20 highest since 1929)
> U.S. oil production: 4.5 billion barrels -- #1 most since 1929
2020
> Avg. U.S. gas prices per gallon (inflation adj.): $2.26 ($2.55 -- #77 highest since 1929)
> U.S. gas consumption: 123.7 billion gallons -- #25 most since 1945
> Per capita gas consumption: 373.2 gallons -- #57 most since 1945
> Price of a barrel of oil (inflation adj.): $36.90 ($41.68 -- #31 highest since 1929)
> U.S. oil production: 4.1 billion barrels -- #3 most since 1929
The image featured at the top of this post is ©jittawit21/Shutterstock.com