What car models hold their value over time? Buying a car can be a heartbreaking prospect if you’re trying to view it like an investment. Typically, you’ll see the value of the car plummet as you drive off the dealership lot. The cars in today’s list won’t have you losing your shirt, however.
#17: Subaru Impreza

©"#17 Nev Jones / Chris Davies - Subaru Impreza" by PhotoDoyl is licensed under BY 2.0. - Original / License
- Average 5-Year Depreciation: 26.2%
- Average $ Difference from MSRP: $6,927
#16: Honda HR-V
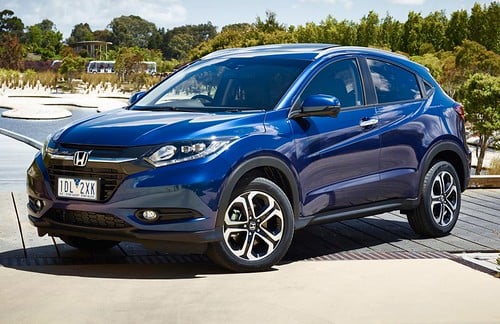
©"2015 Honda HR-V VTi-L: Australia's Auto Sales - March 2015:" by TuRbO_J is licensed under BY 2.0. - Original / License
- Average 5-Year Depreciation: 26.2%
- Average $ Difference from MSRP: $7,318
#15: Porsche 911 Convertible
©"Porsche 911 SC convertable exterior" by wbaiv is licensed under BY-SA 2.0. - Original / License
- Average 5-Year Depreciation: 26.0%
- Average $ Difference from MSRP: $42,227
#14: Kia Rio 5-door

©"2017 Kia Rio 2 1.3 Front" by Makizox is licensed under BY-SA 4.0. - Original / License
- Average 5-Year Depreciation: 25.8%
- Average $ Difference from MSRP: $5,006
#13: Toyota Tundra
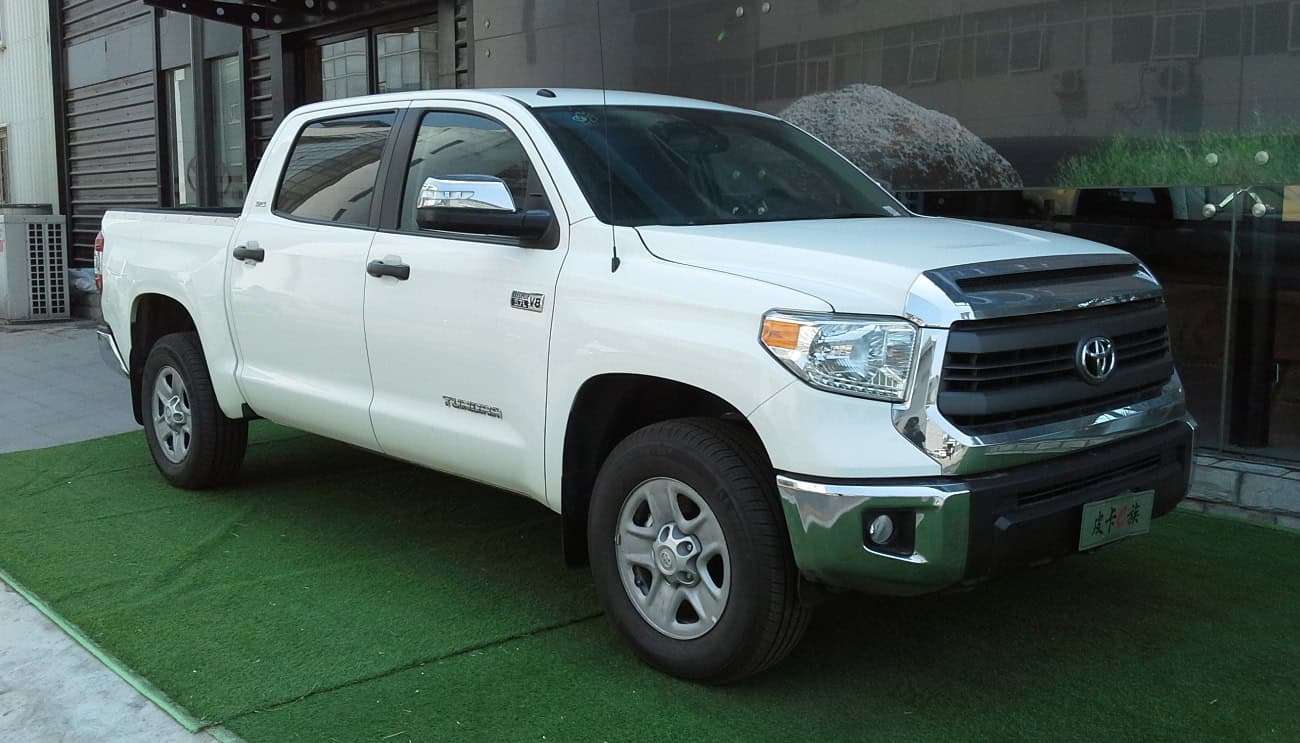
©"Toyota Tundra III CrewMax 2 China 2015-04-13" by Navigator84 is licensed under BY-SA 4.0. - Original / License
- Average 5-Year Depreciation: 25.3%
- Average $ Difference from MSRP: $12,588
#12: Porsche 718 Boxster
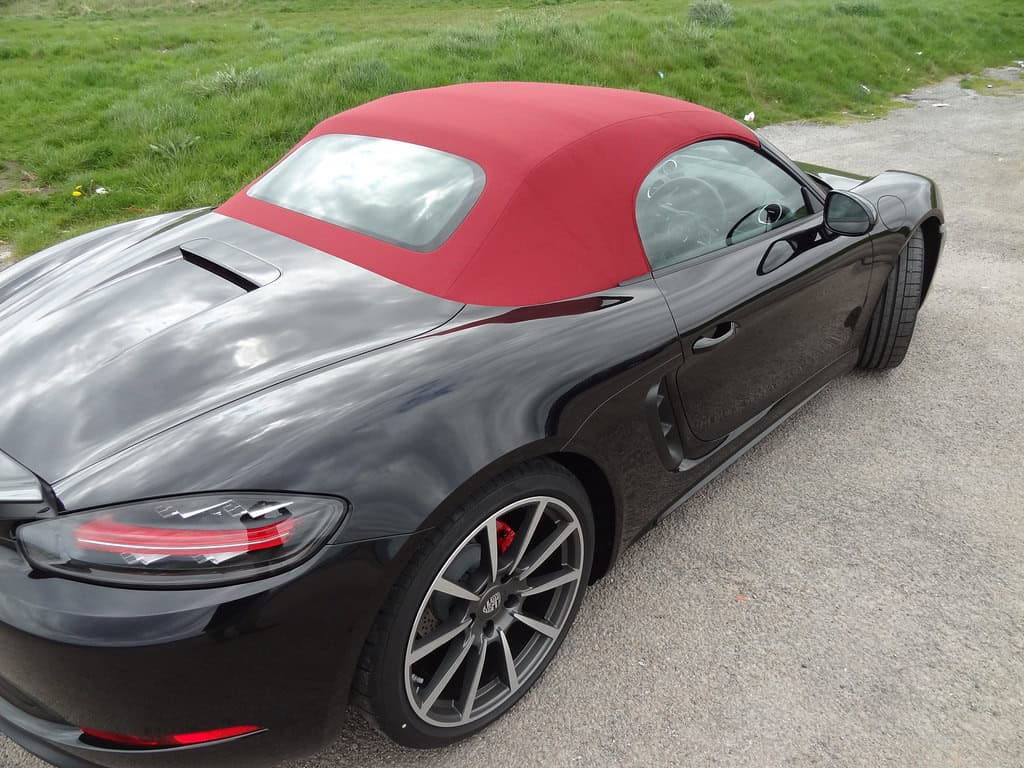
©"Porsche Boxster 718 S (12)" by IainCameron is licensed under BY 2.0. - Original / License
- Average 5-Year Depreciation: 25.1%
- Average $ Difference from MSRP: $20,216
#11: Ford Mustang
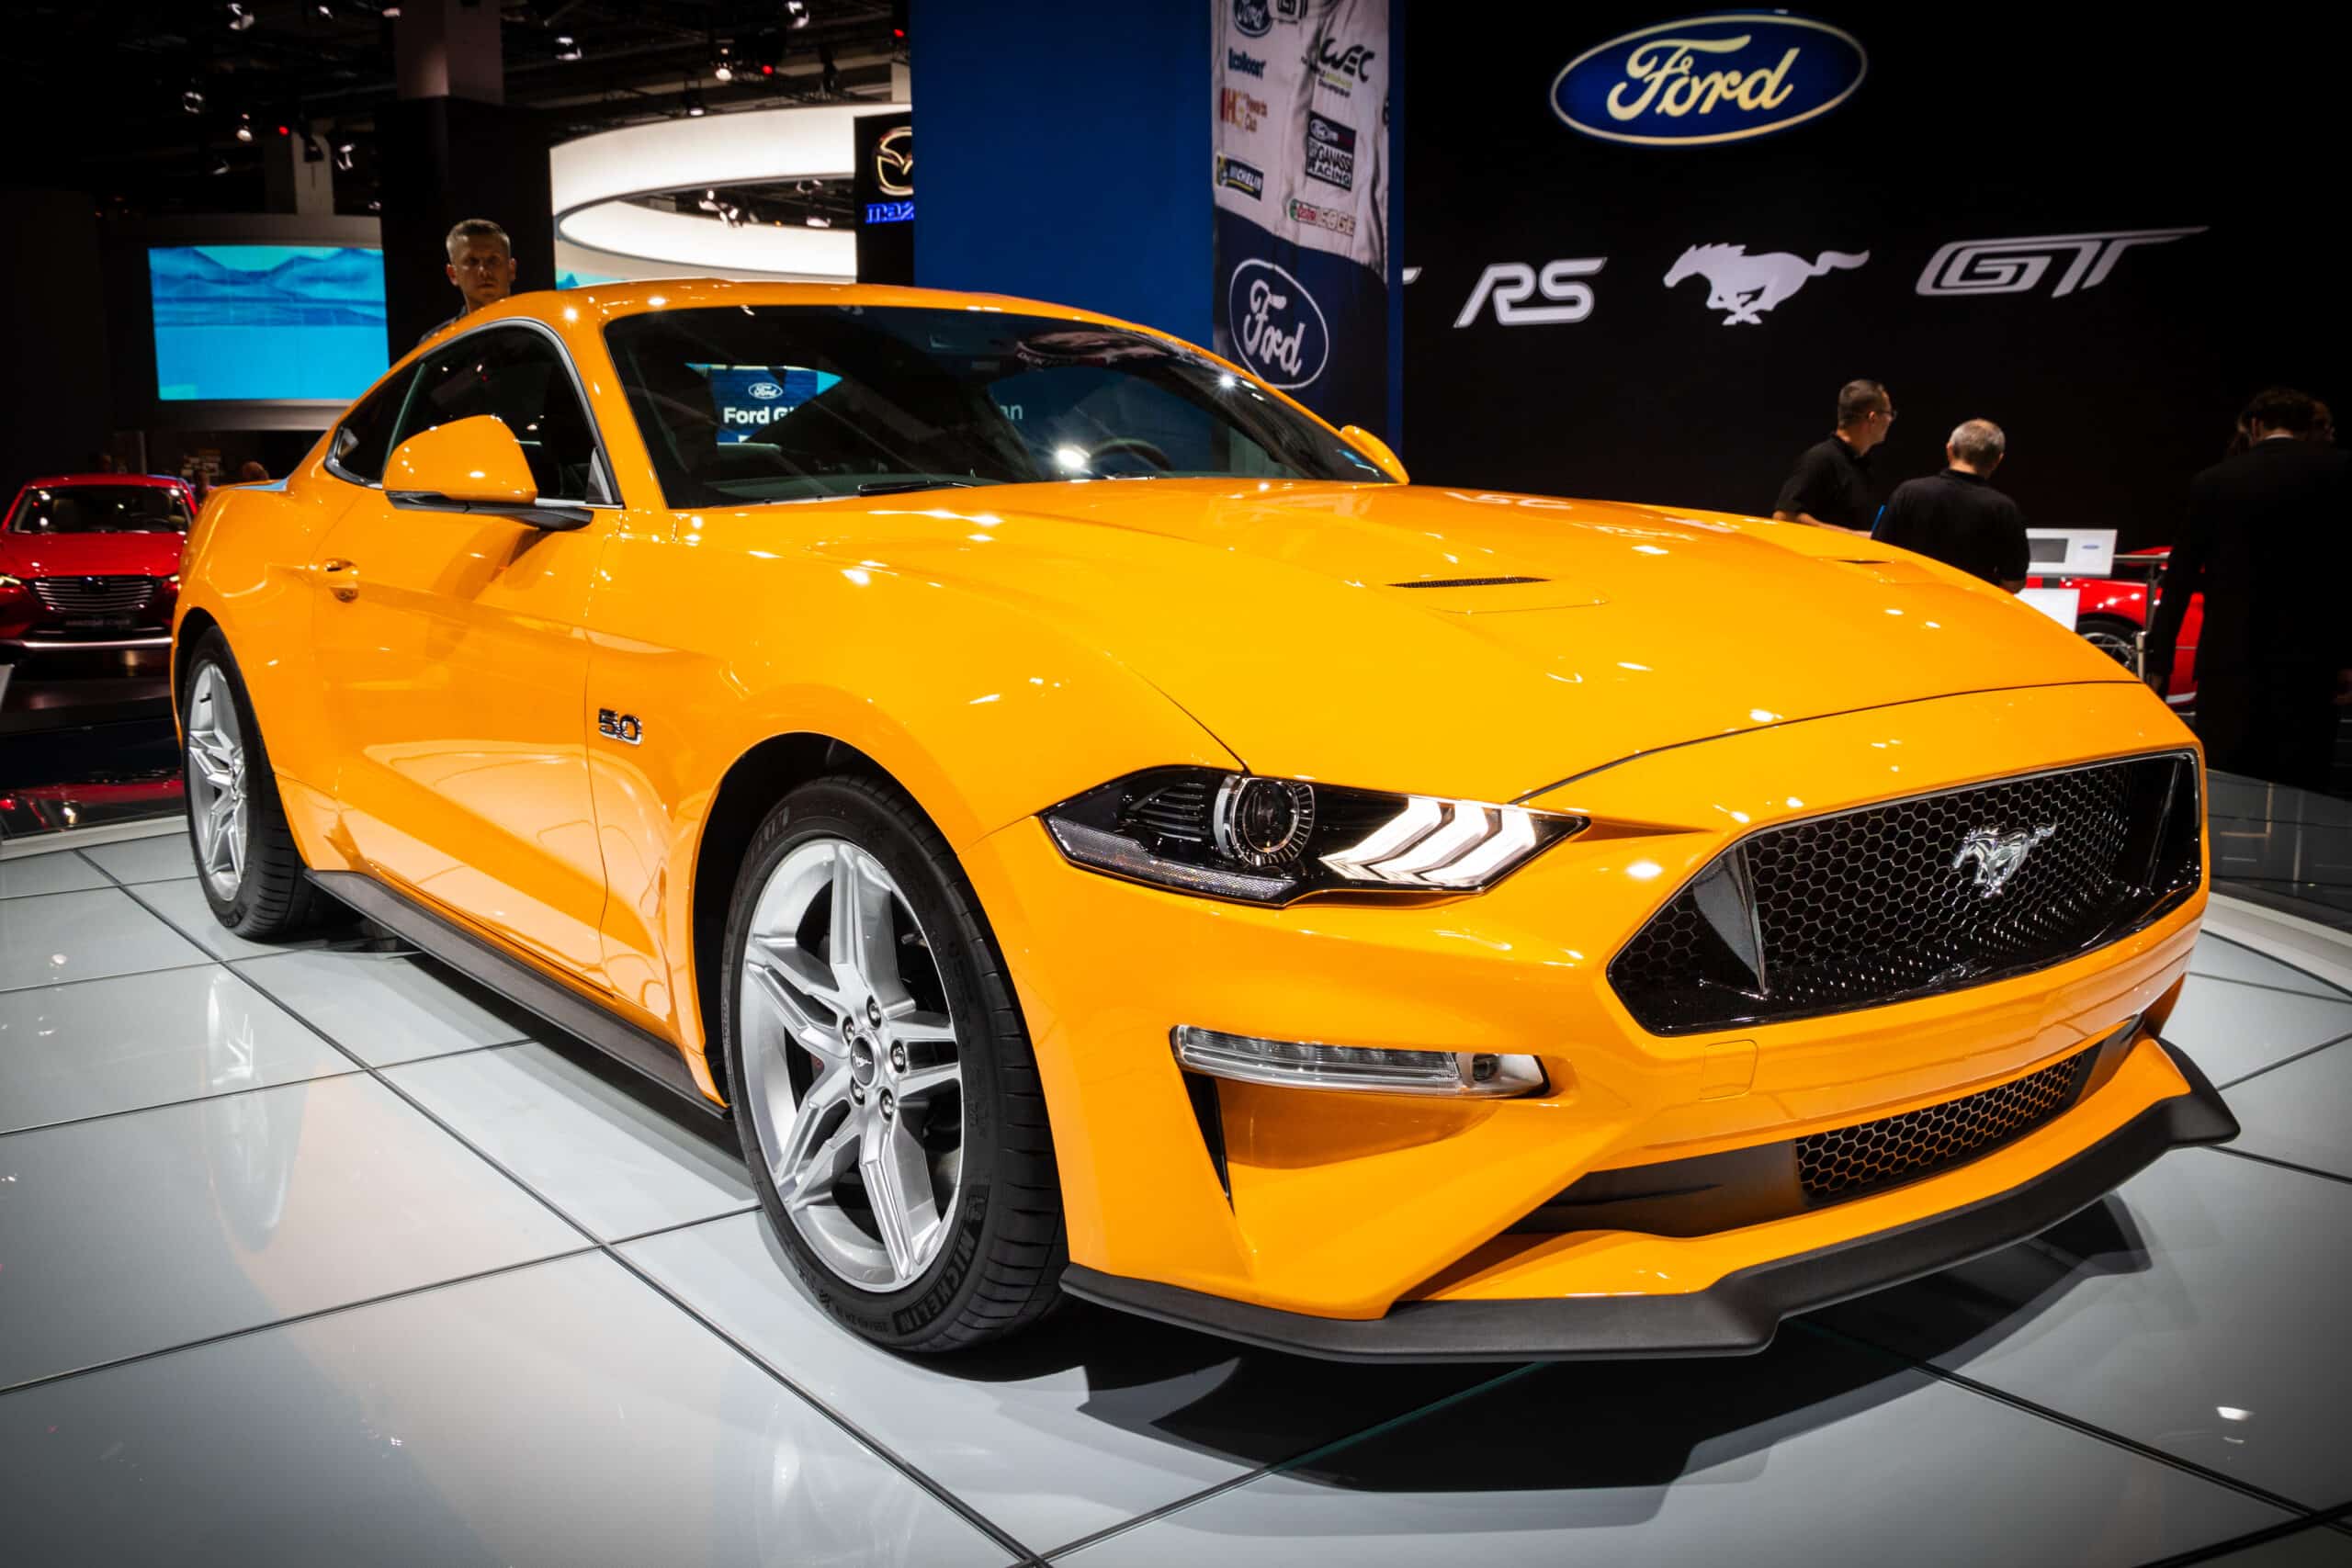
©VanderWolf Images/Shutterstock.com
- Average 5-Year Depreciation: 24.5%
- Average $ Difference from MSRP: $10,035
#10: Toyota Corolla

©"2018 Toyota Corolla (ZWE211R) ZR hybrid hatchback (2018-10-30) 01" by EurovisionNim is licensed under BY-SA 4.0. - Original / License
- Average 5-Year Depreciation: 24.5%
- Average $ Difference from MSRP: $5,800
#9: Subaru Crosstrek
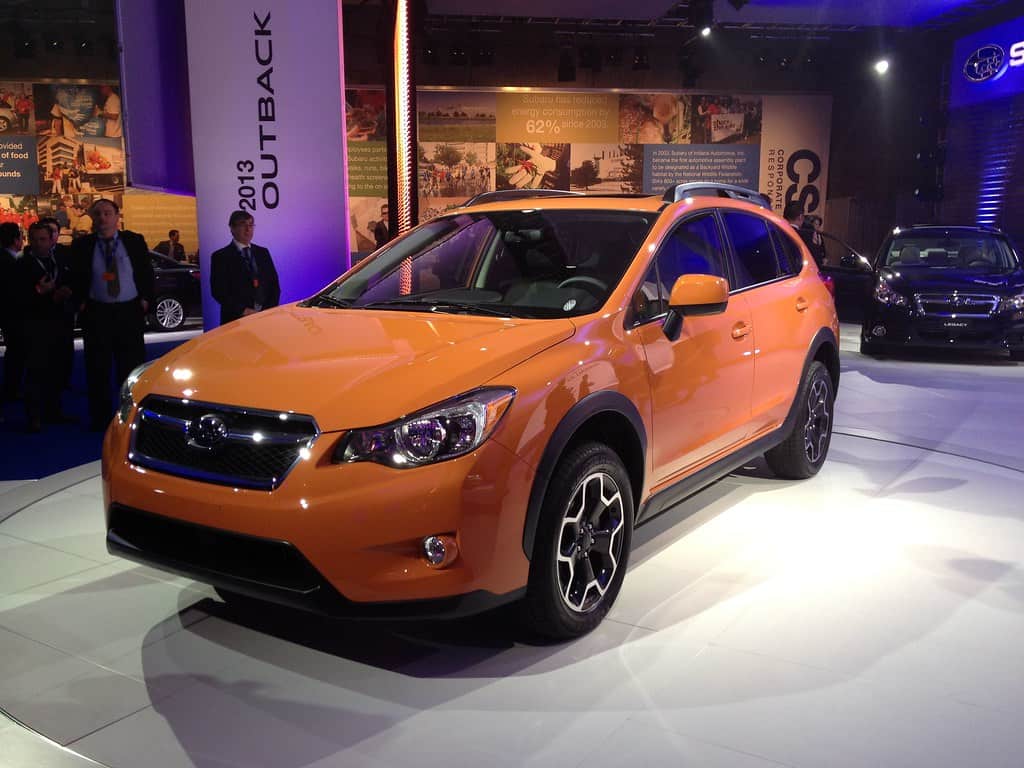
©"The New Subaru XV Crosstrek @ the 2012 New York International Auto Show" by lotprocars is licensed under BY-SA 2.0. - Original / License
- Average 5-Year Depreciation: 24.5%
- Average $ Difference from MSRP: $7,214
#8: Toyota C-HR

©"TOYOTA C-HR China (8)" by Dinkun Chen is licensed under BY-SA 4.0. - Original / License
- Average 5-Year Depreciation: 24.4%
- Average $ Difference from MSRP: $6,692
#7: Chevrolet Camaro
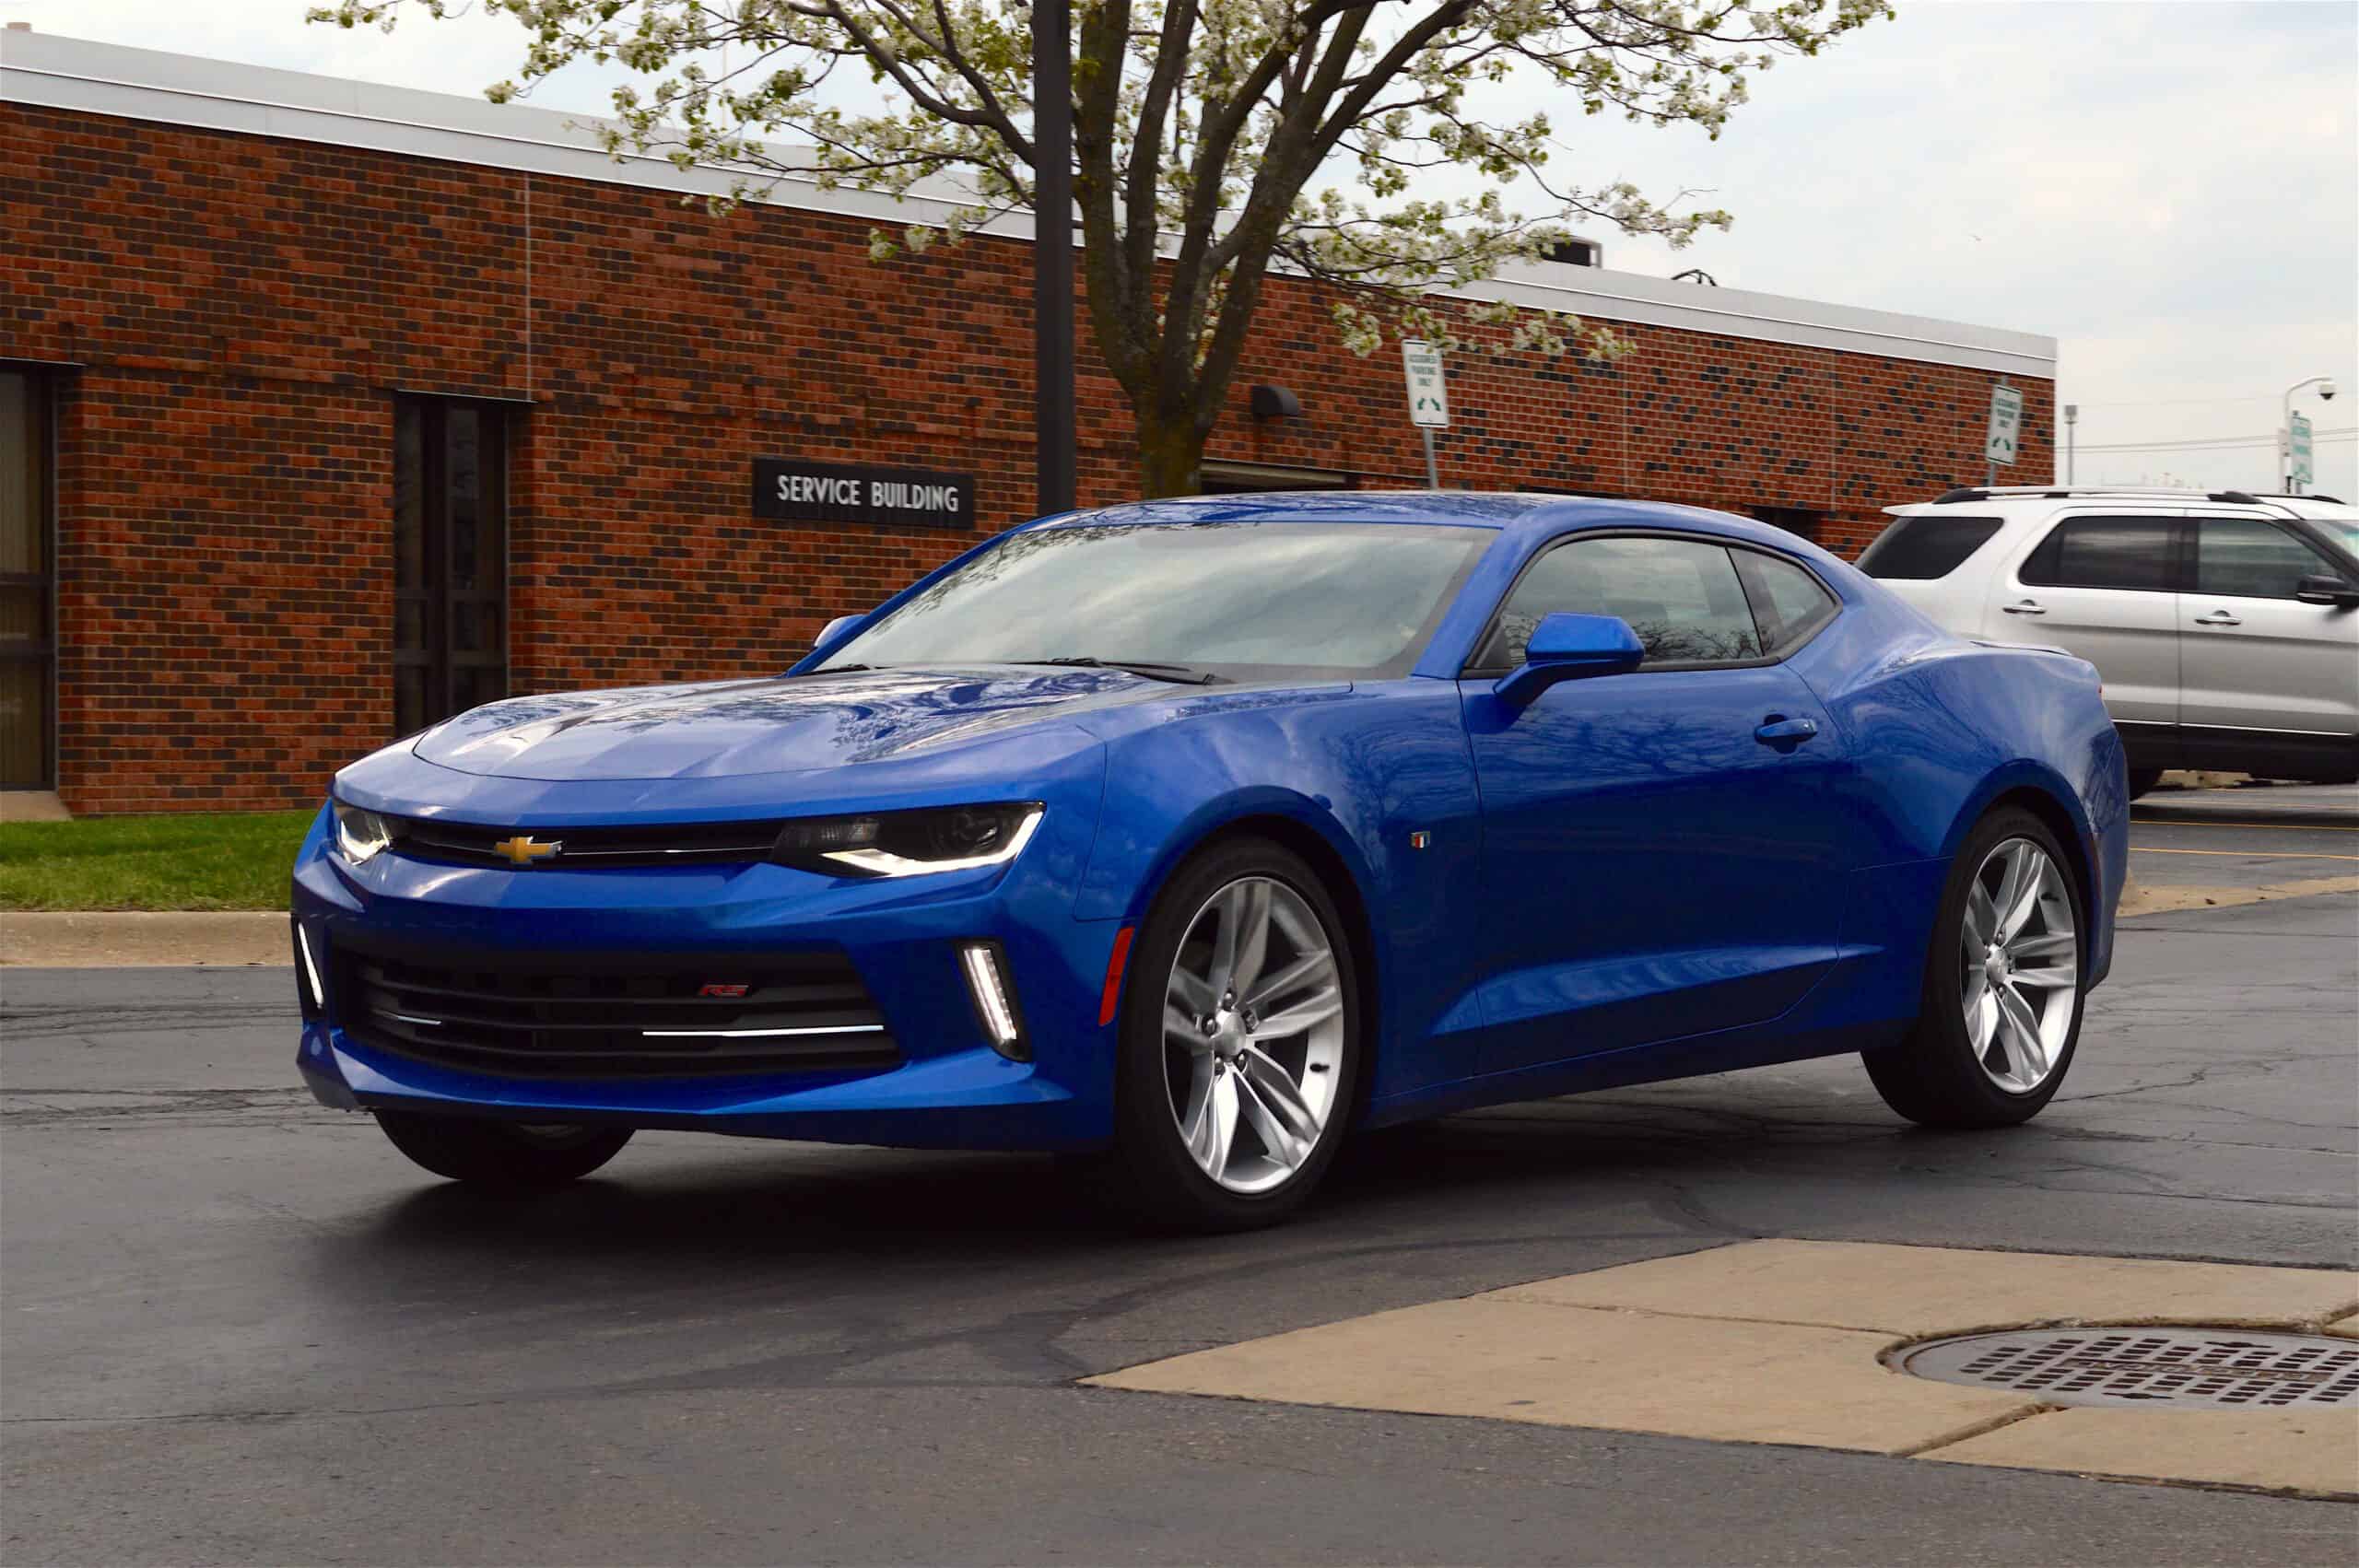
©Yahya S. from United States / CC BY 2.0 - Original / License
- Average 5-Year Depreciation: 24.2%
- Average $ Difference from MSRP: $10,161
#6: Subaru BRZ
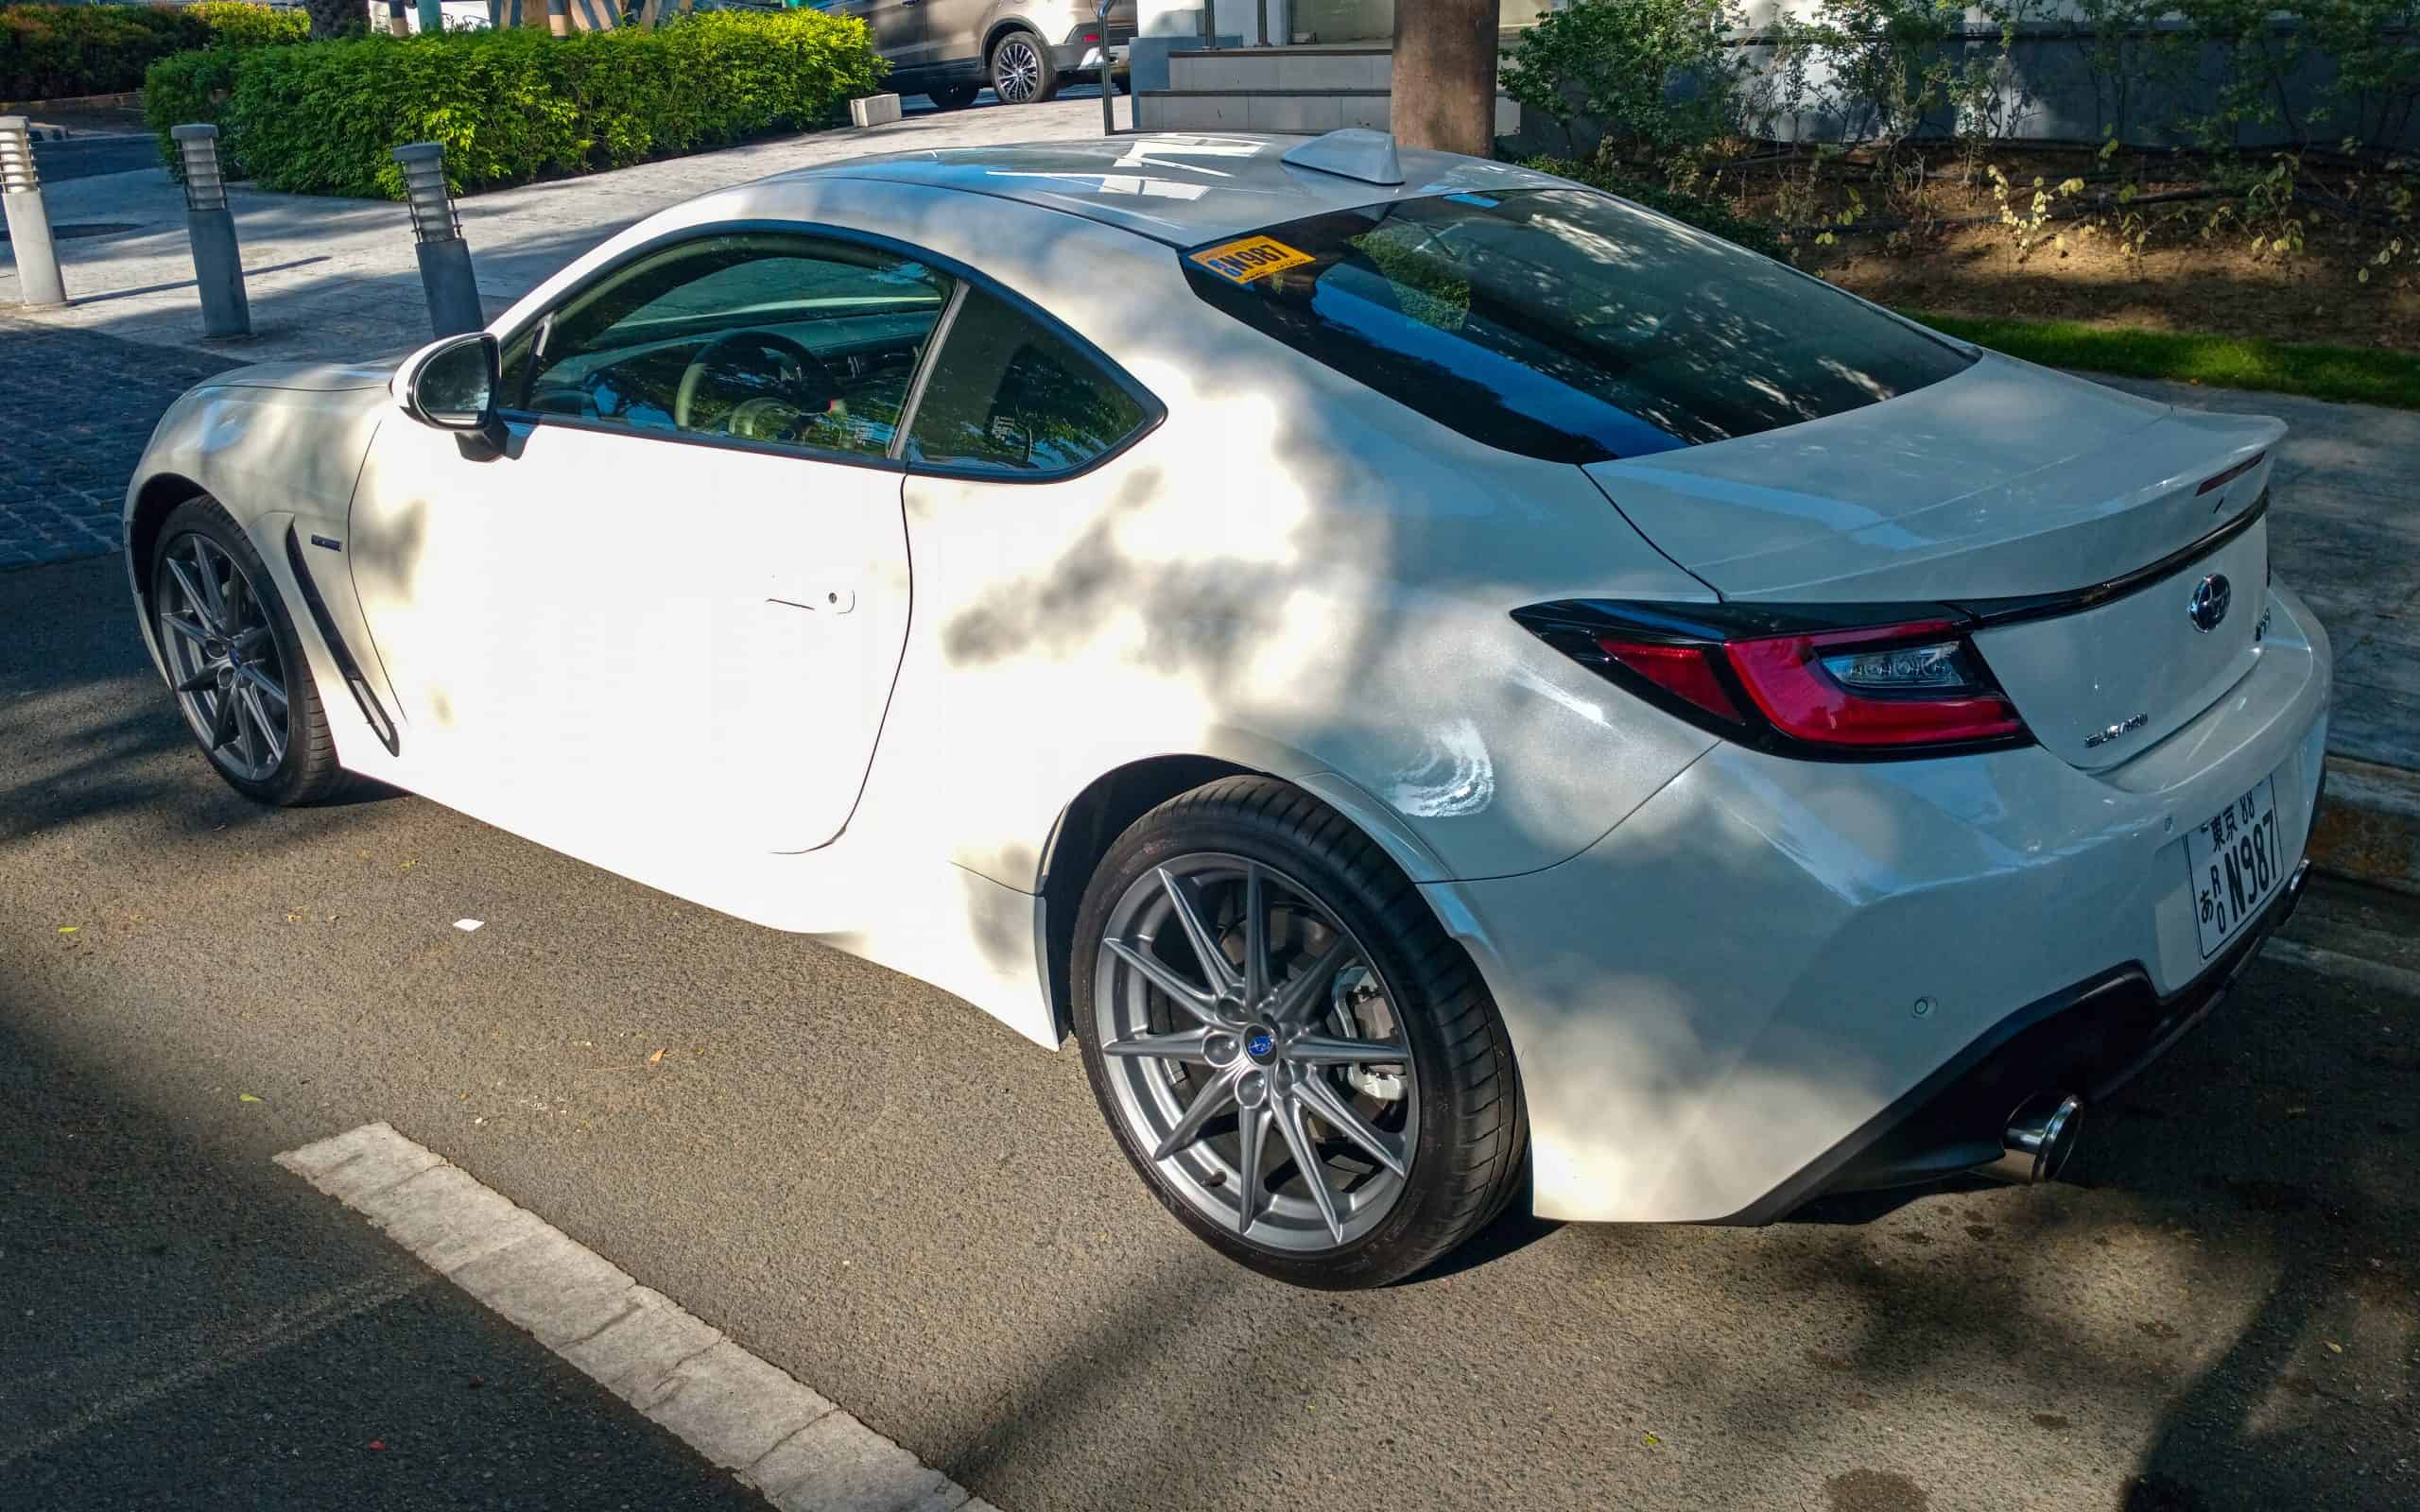
©"Subaru BRZ 2.4 'Eyesight' 2023 (6)" by Ethan Llamas is licensed under BY-SA 4.0. - Original / License
- Average 5-Year Depreciation: 23.4%
- Average $ Difference from MSRP: $8,114
#5: Honda Civic

©"Honda Civic 5" by E.R.R is licensed under BY-SA 2.0. - Original / License
- Average 5-Year Depreciation: 21.5%
- Average $ Difference from MSRP: $5,817
#4: Jeep Wrangler
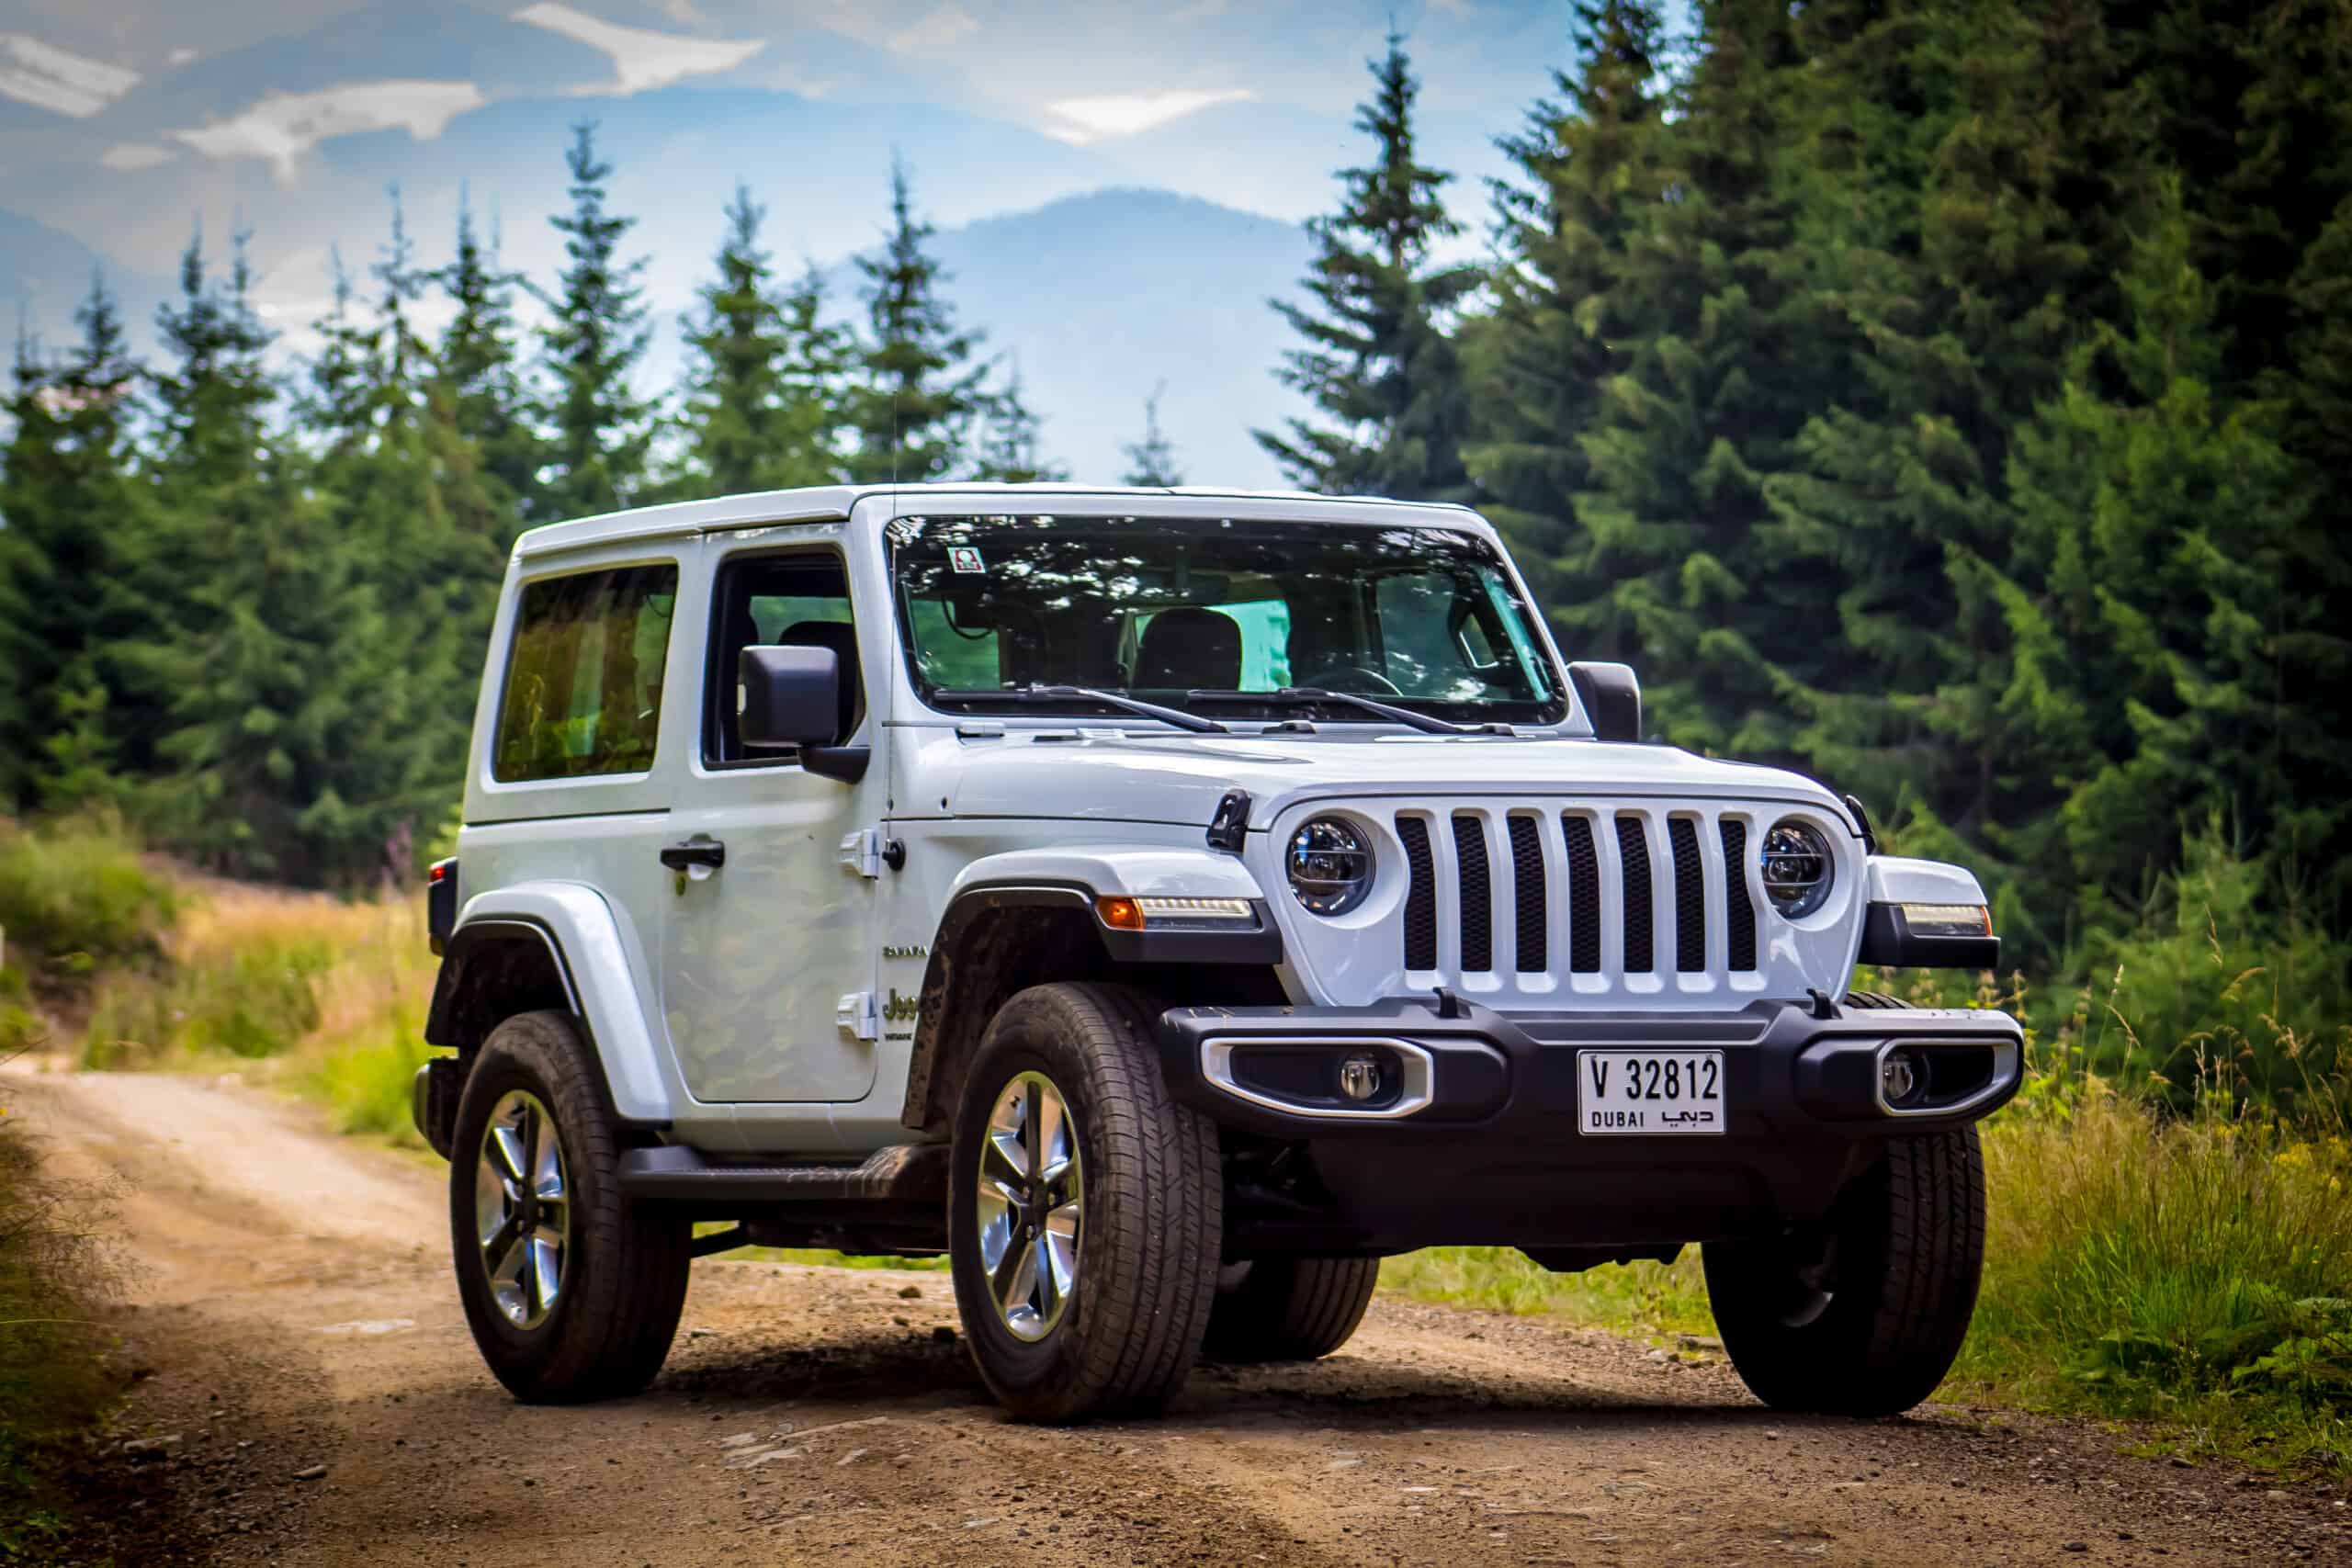
©Tom B Paye/Shutterstock.com
- Average 5-Year Depreciation: 20.8%
- Average $ Difference from MSRP: $8,951
#3: Toyota Tacoma
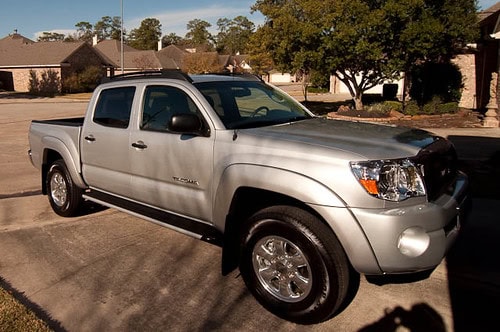
©"New Tacoma (3 of 6)" by dataloss is licensed under BY 2.0. - Original / License
- Average 5-Year Depreciation: 20.4%
- Average $ Difference from MSRP: $8,359
#2: Porsche 718 Cayman
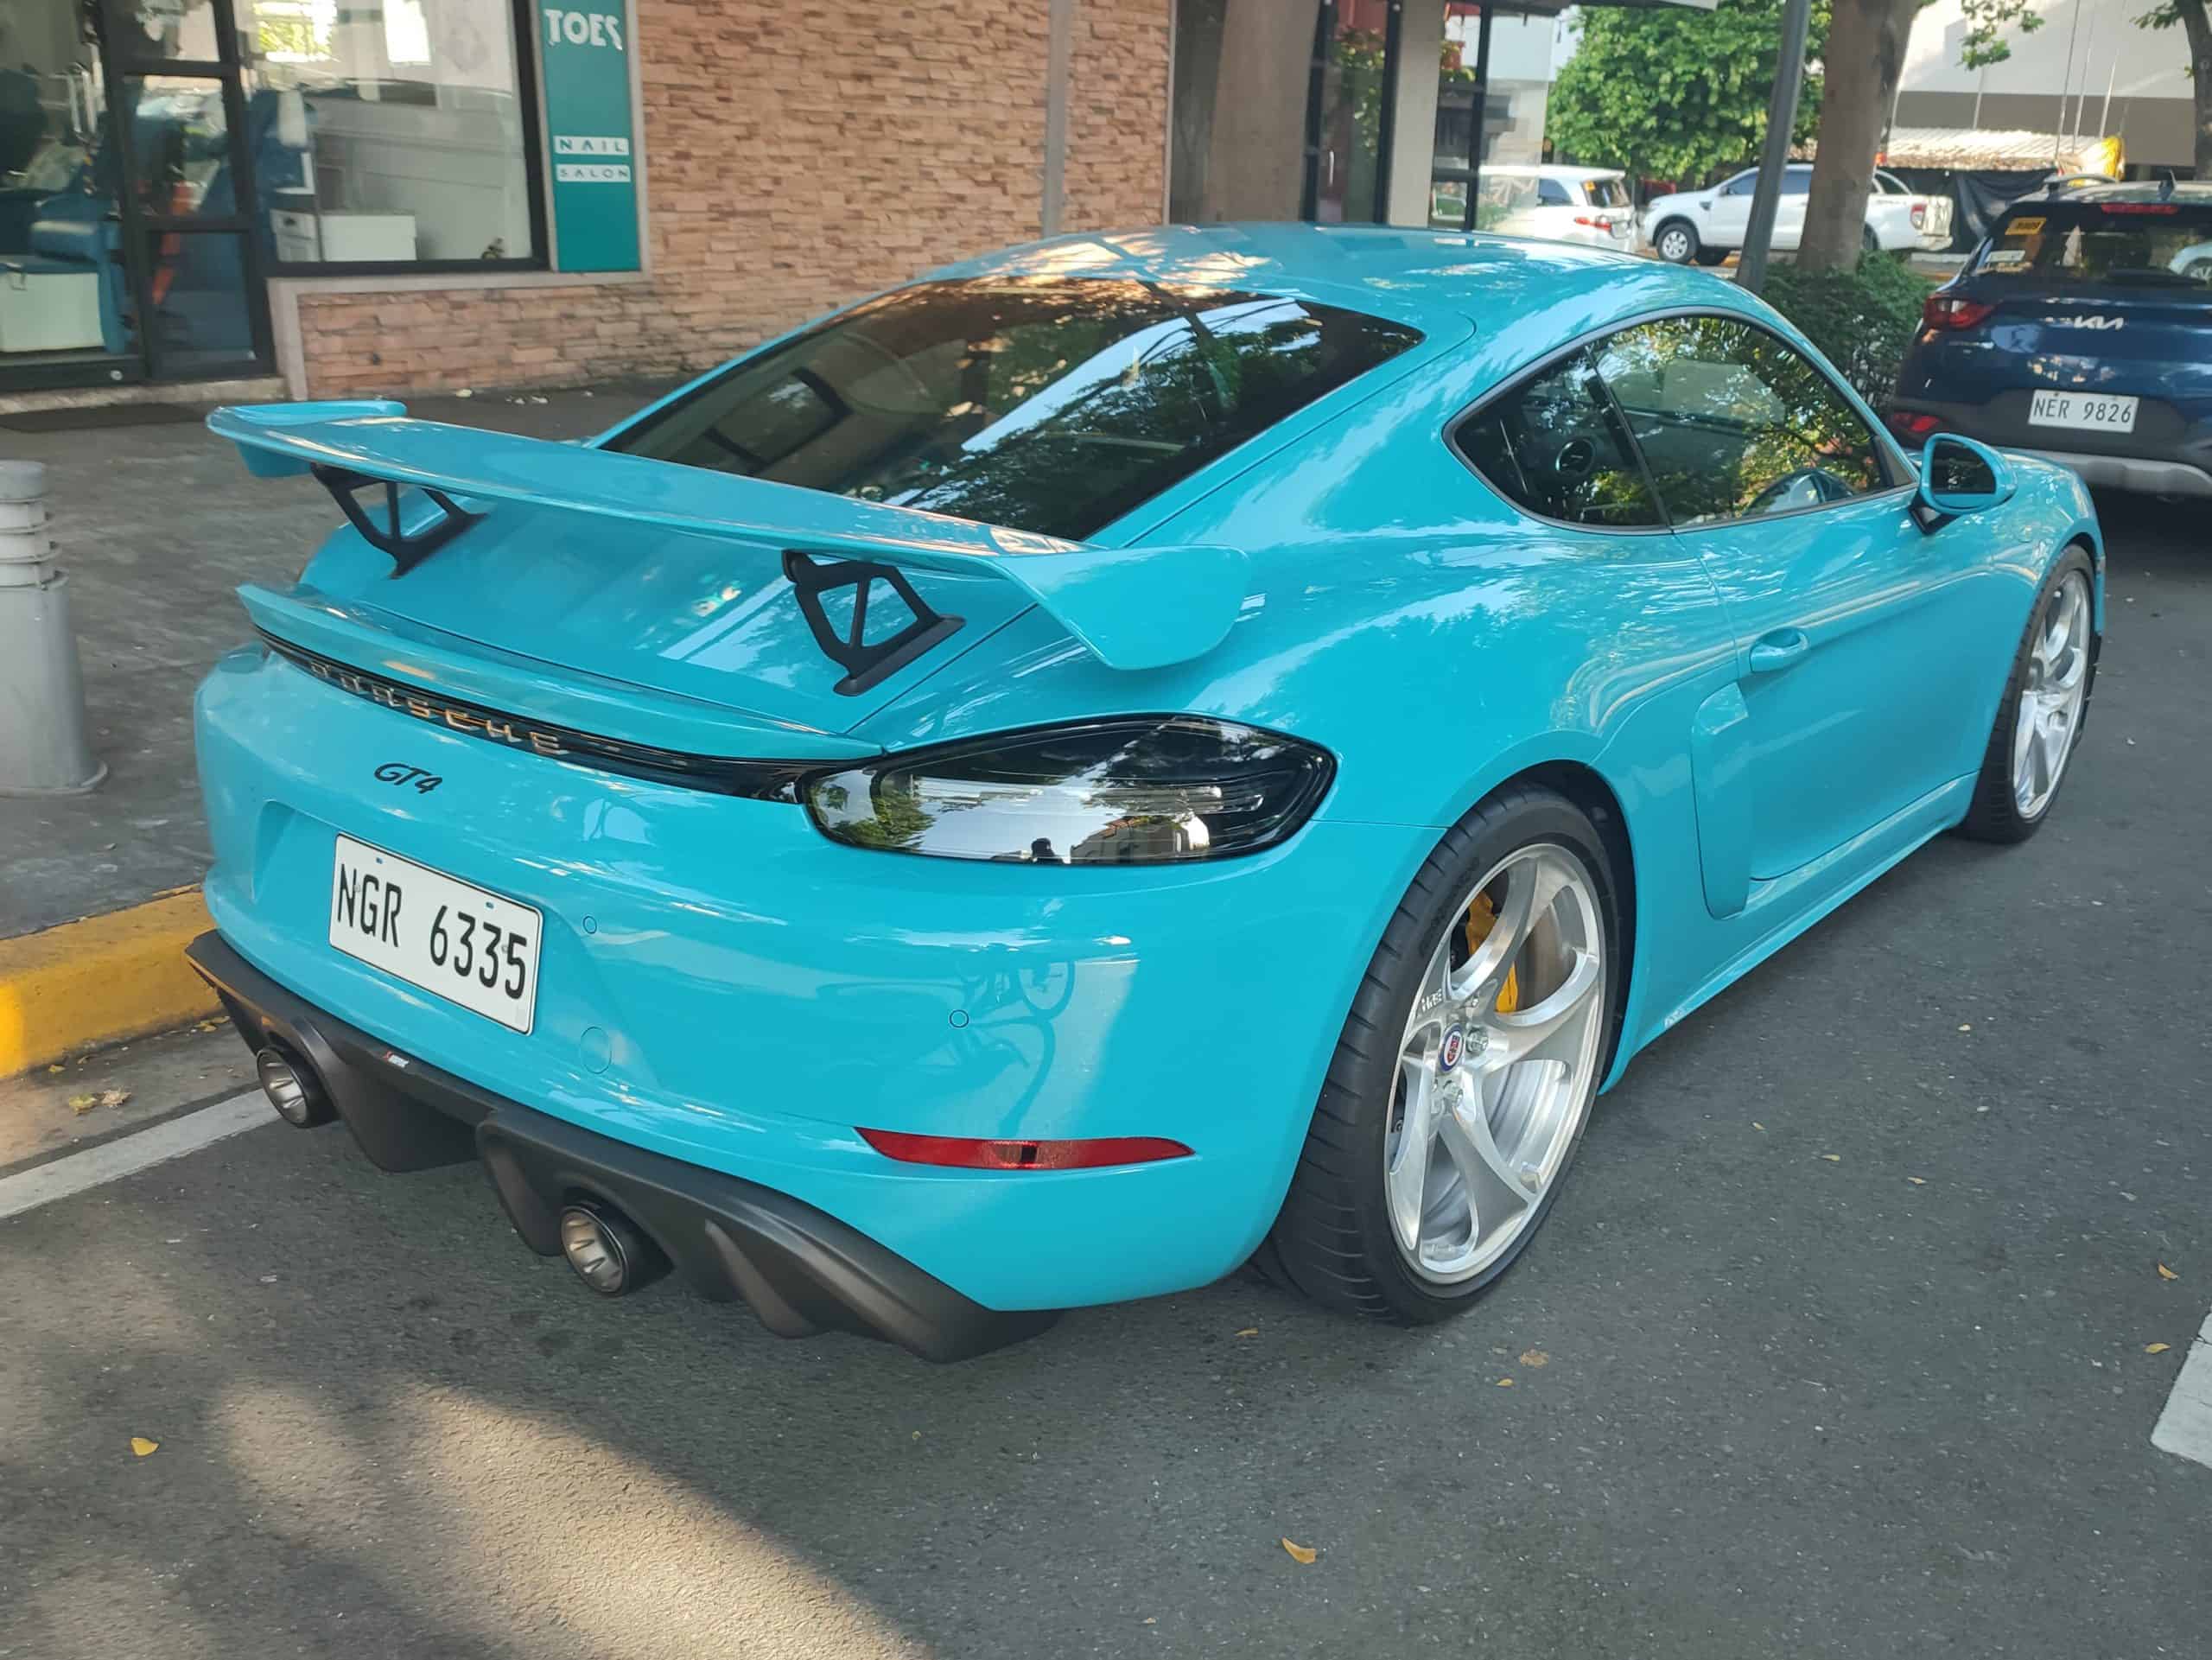
©"Porsche 718 Cayman GT4 2021 (2)" by Ethan Llamas is licensed under BY-SA 4.0. - Original / License
- Average 5-Year Depreciation: 17.6%
- Average $ Difference from MSRP: $13,372
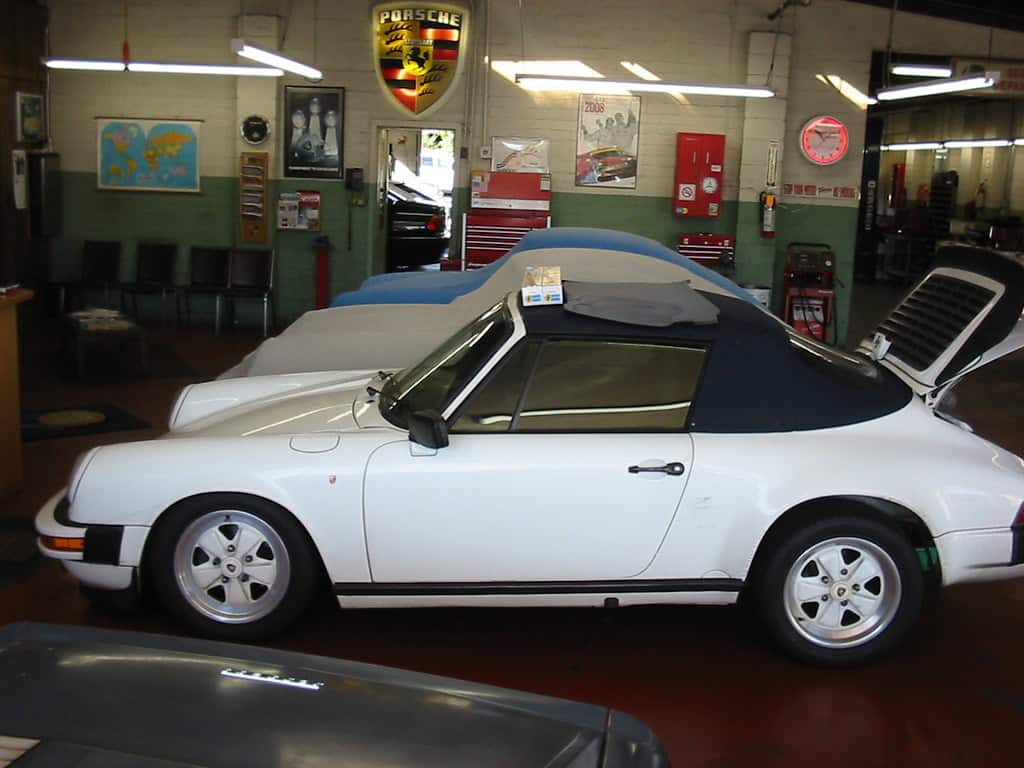
#1: Porsche 911 Coupe
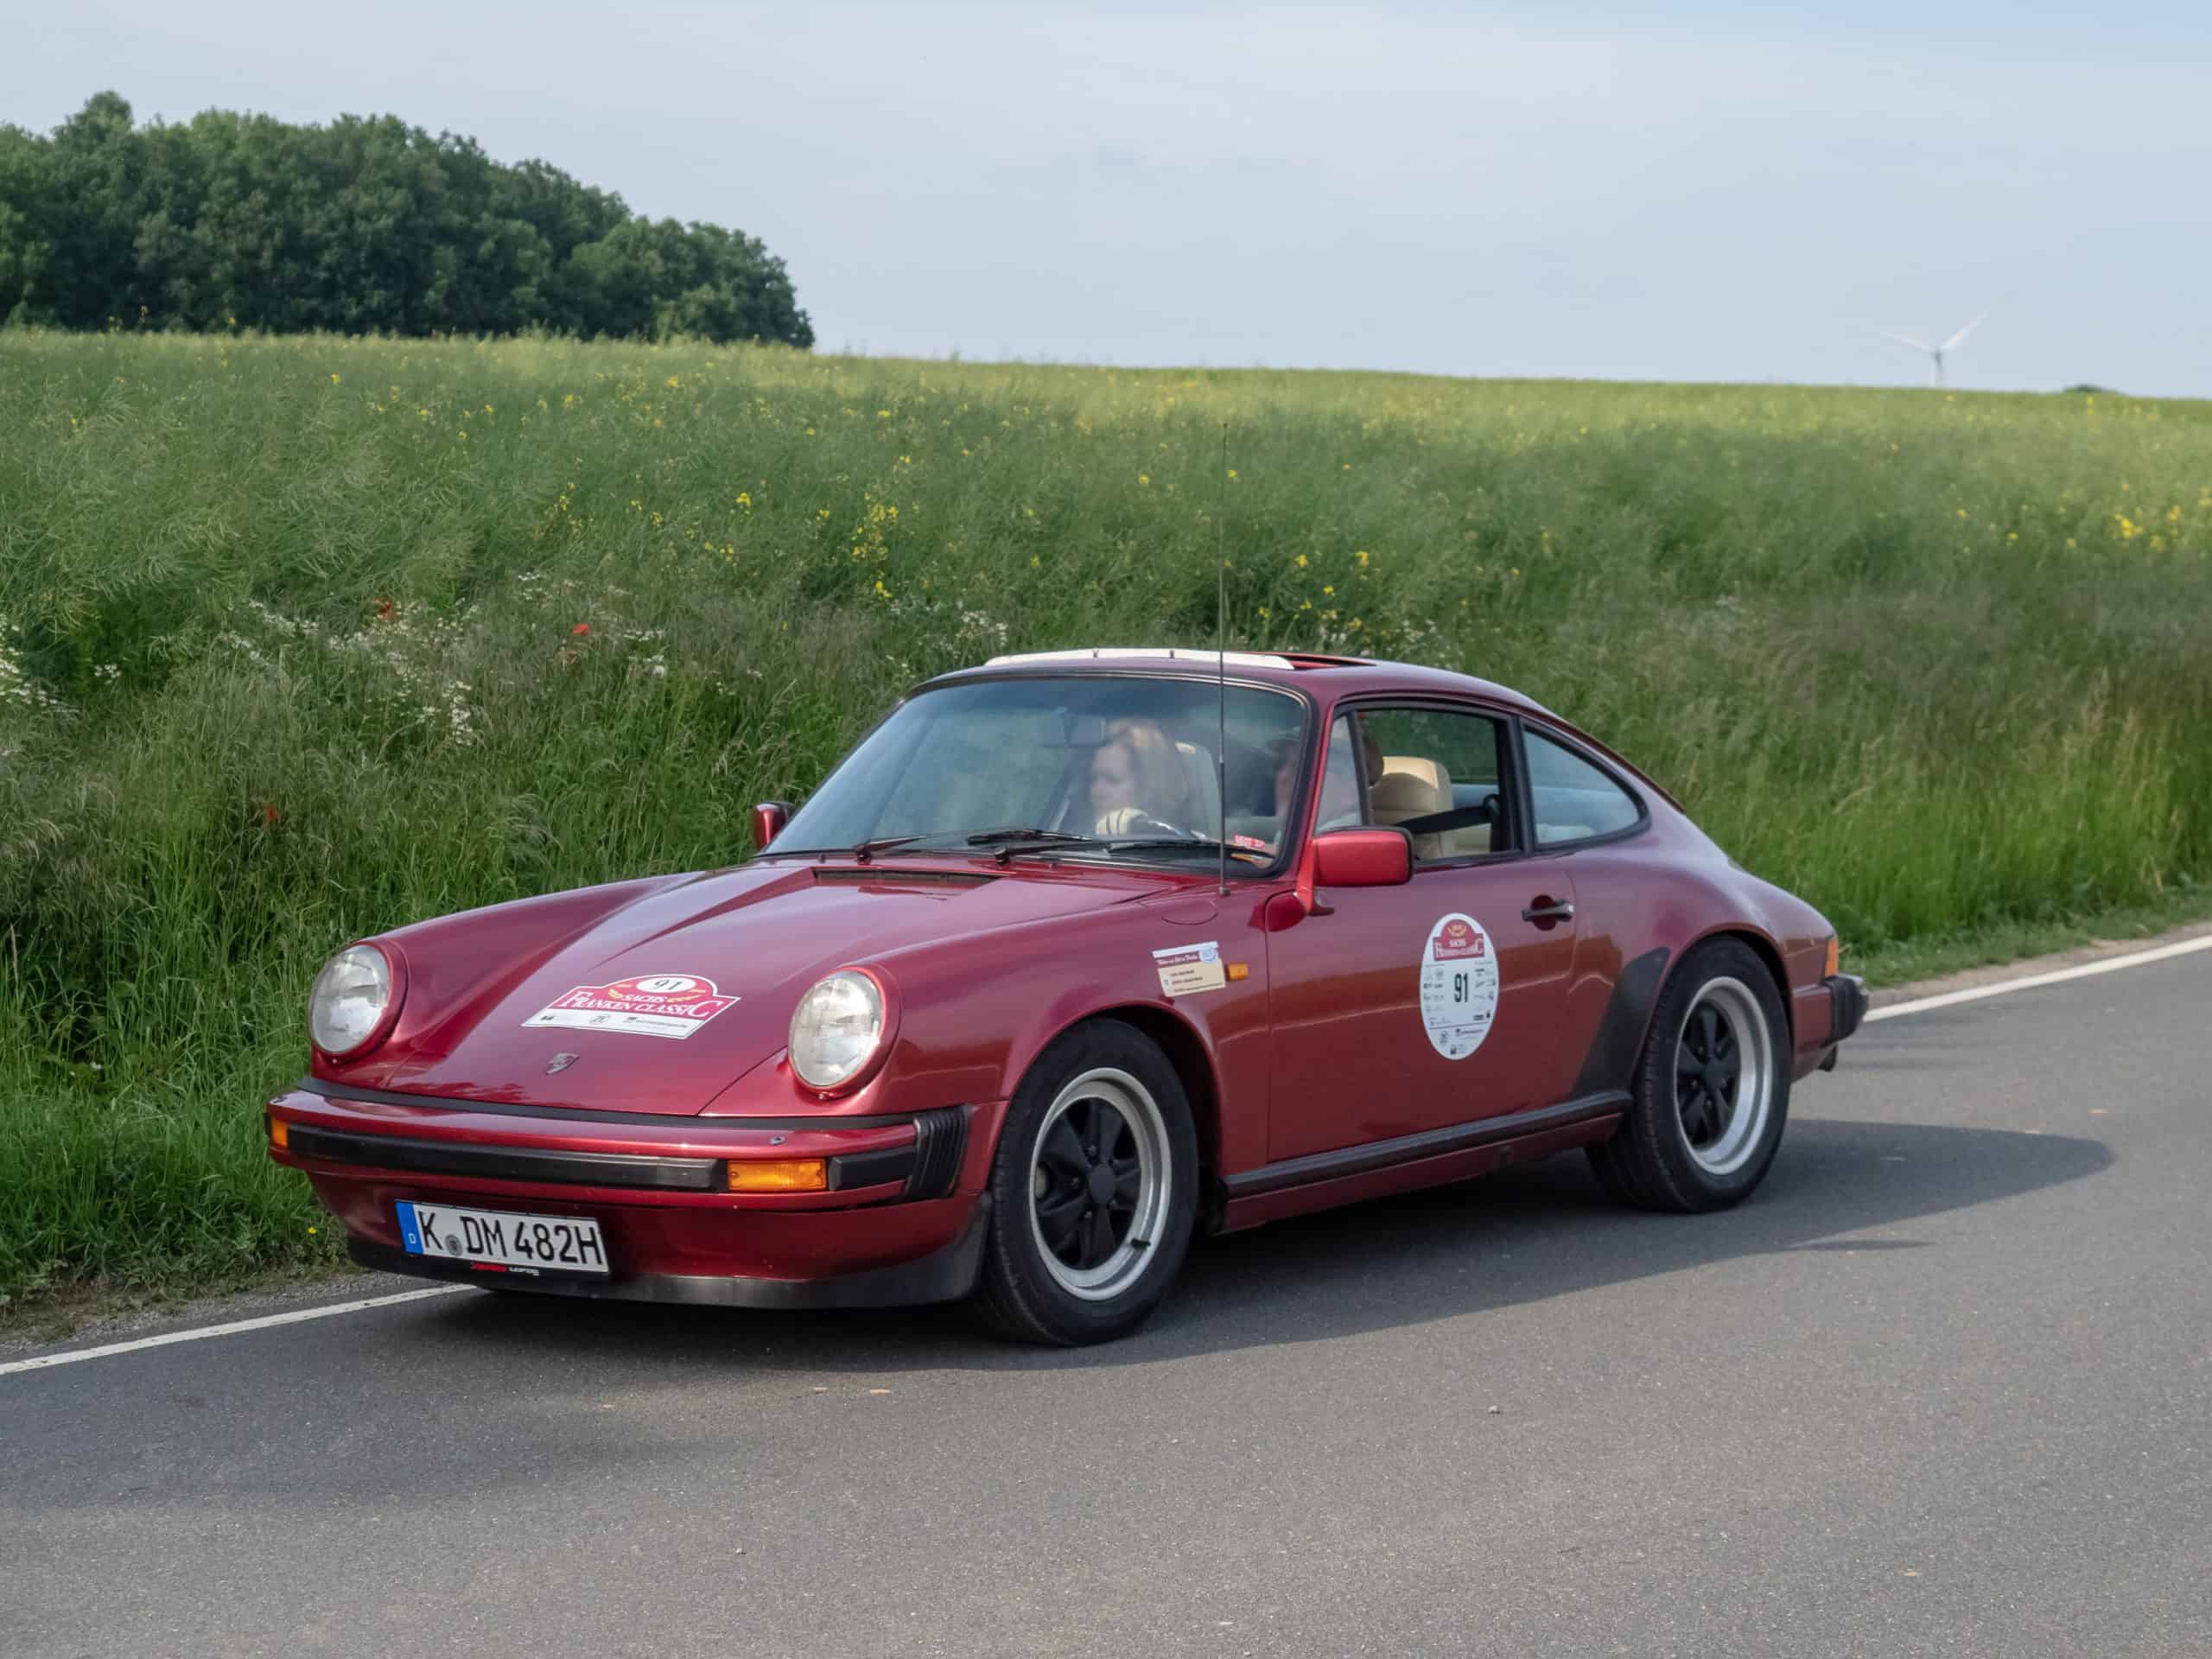
©"Porsche 911 SC 3.0 Coupe 5190566" by Ermell is licensed under BY-SA 4.0. - Original / License
- Average 5-Year Depreciation: 9.3%
- Average $ Difference from MSRP: $18,094
The image featured at the top of this post is ©skirgaila photography/Shutterstock.com.