© Stefan Malloch/ via Getty Images
© sdbower / iStock via Getty Images
© pavdw / Flickr
© ricardoreitmeyer / iStock via Getty Images

© Jon Bilous / iStock via Getty Images
© Paul Massie Photography / iStock via Getty Images
© marekuliasz / iStock via Getty Images
© LawrenceSawyer / E+ via Getty Images
© bryanakers / iStock via Getty Images
© Famartin / CC BY-SA 3.0 / Wikimedia Commons
© Jennifer Yakey-Ault / iStock via Getty Images
© Sean Pavone / iStock via Getty Images
© KenCanning / E+ via Getty Images
© Richard Wood / iStock via Getty Images
© Khosro / Shutterstock.com
© amanderson2 / CC BY 2.0 / Flickr
© luvemakphoto / iStock via Getty Images
© Christina Gray / Moment via Getty Images
© wangjs / Flickr
© johnandersonphoto / Getty Images
© Christine Warner-Morin / CC BY 2.0 / Flickr
© DejaVu Designs / iStock via Getty Images
© Laurie Drake / iStock via Getty Images
© jariceiii / Flickr
© James St. John / CC BY 2.0 / Flickr
© kanonsky / iStock via Getty Images
© KenCanning / E+ via Getty Images
© jdwfoto / iStock via Getty Images
© mirceax / iStock via Getty Images

© Pjard / iStock via Getty Images


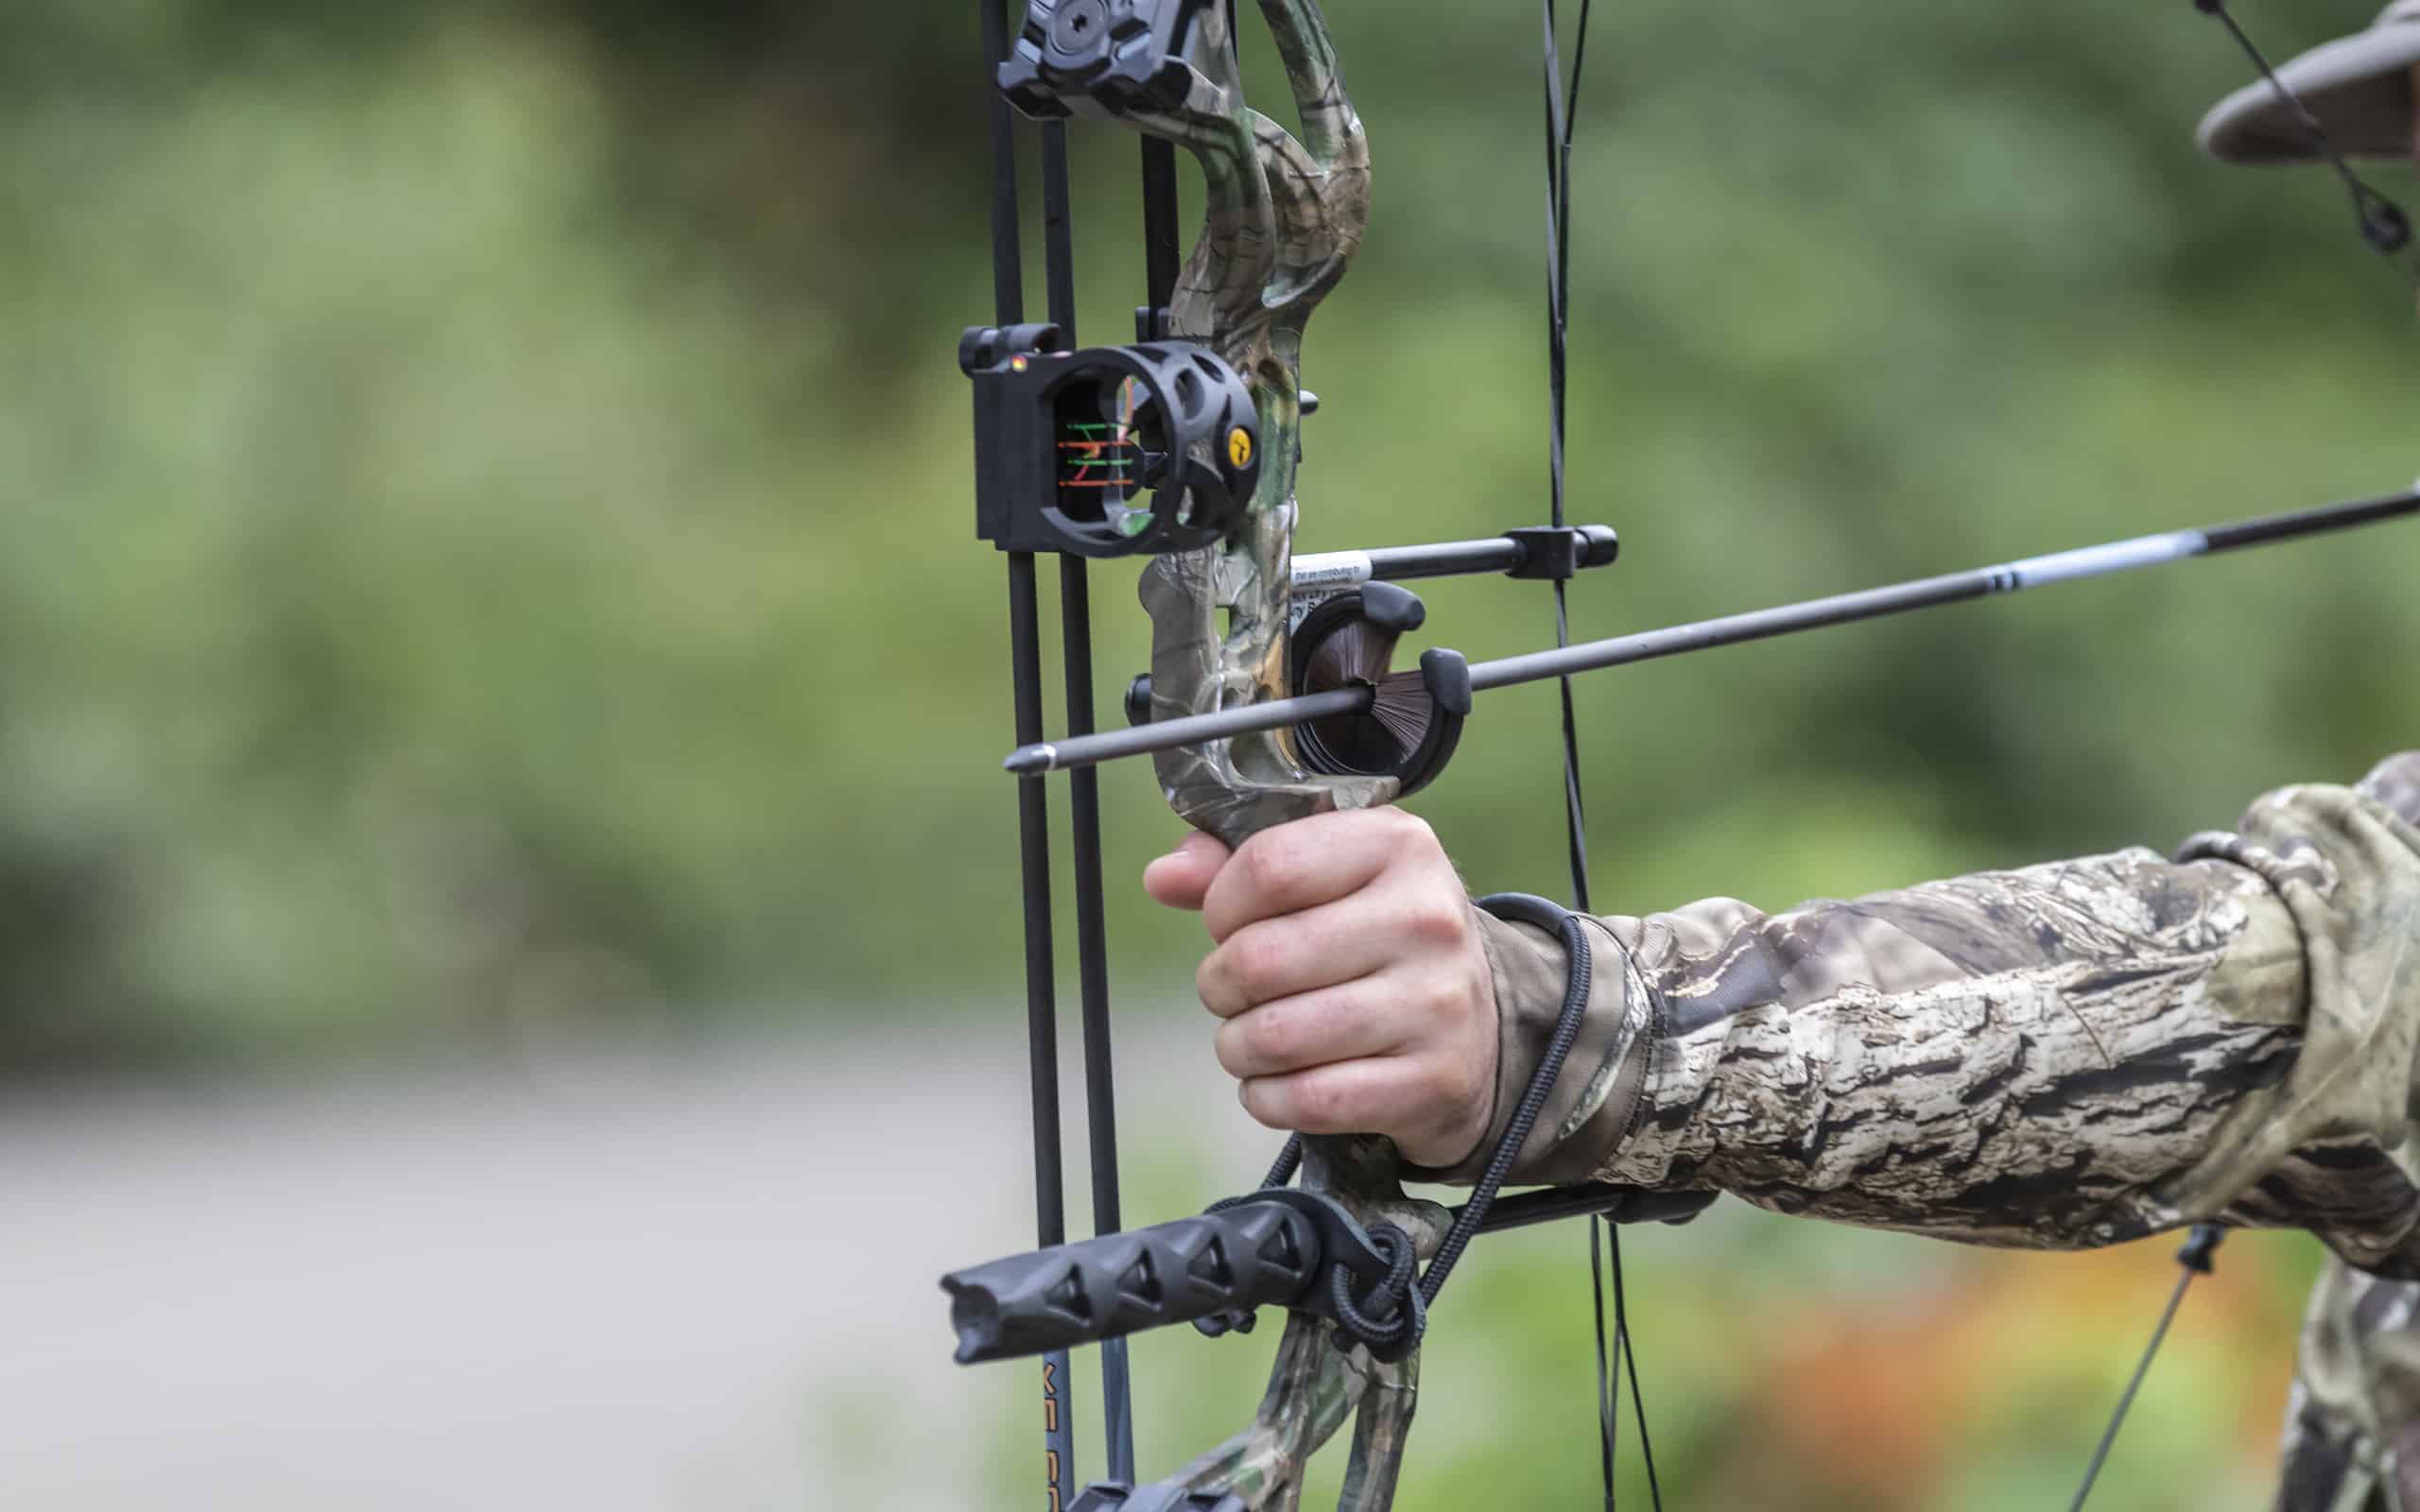
The Top States Where Black Powder Hunters Strike Gold
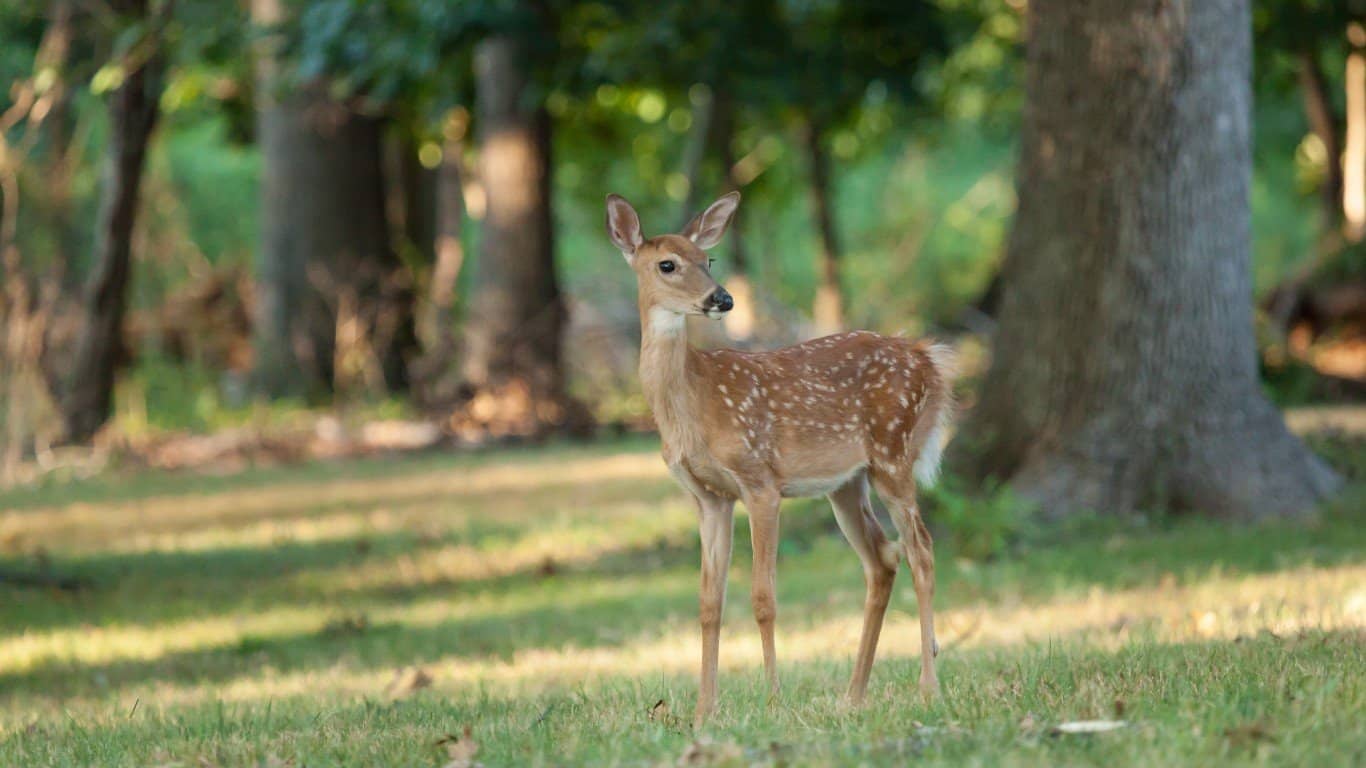
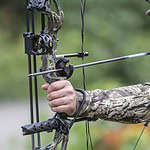
In the world of hunting, you have any number of ways to accomplish your mission of taking home a top prize. One of these methods is black powder, and although it’s no longer one of the most popular hunting methods you can find today, some hunters are enormous fans and vocal proponents of using black powder to get the job done.
29. Alabama
- Share of deer harvested with a muzzleloader in 2022: 3% (approx. 9,262 deer)
- Total deer harvested in 2022: 308,729 (44.6% antlered buck, 55.4% antlerless deer)
- Paid hunting license holders in 2022: 95.9 per 1,000 people (486,674 total)
28. Maine
- Share of deer harvested with a muzzleloader in 2022: 4% (approx. 1,751 deer)
- Total deer harvested in 2022: 43,787 (54.4% antlered buck, 45.6% antlerless deer)
- Paid hunting license holders in 2022: 154.2 per 1,000 people (213,686 total)
27. Kansas
- Share of deer harvested with a muzzleloader in 2022: 4% (approx. 3,233 deer)
- Total deer harvested in 2022: 80,815 (51.9% antlered buck, 48.1% antlerless deer)
- Paid hunting license holders in 2022: 94.3 per 1,000 people (277,050 total)
26. West Virginia
- Share of deer harvested with a muzzleloader in 2022: 5% (approx. 5,925 deer)
- Total deer harvested in 2022: 118,499 (60.4% antlered buck, 39.6% antlerless deer)
- Paid hunting license holders in 2022: 149.3 per 1,000 people (265,103 total)
25. Michigan
- Share of deer harvested with a muzzleloader in 2022: 5% (approx. 16,959 deer)
- Total deer harvested in 2022: 339,189 (60.1% antlered buck, 39.9% antlerless deer)
- Paid hunting license holders in 2022: 63.2 per 1,000 people (634,627 total)
24. Nebraska
- Share of deer harvested with a muzzleloader in 2022: 6% (approx. 2,417 deer)
- Total deer harvested in 2022: 40,289 (58.1% antlered buck, 41.9% antlerless deer)
- Paid hunting license holders in 2022: 122.6 per 1,000 people (241,271 total)
23. Minnesota
- Share of deer harvested with a muzzleloader in 2022: 6% (approx. 10,336 deer)
- Total deer harvested in 2022: 172,265 (51.2% antlered buck, 48.8% antlerless deer)
- Paid hunting license holders in 2022: 94.8 per 1,000 people (542,085 total)
22. Ohio
- Share of deer harvested with a muzzleloader in 2022: 6% (approx. 12,658 deer)
- Total deer harvested in 2022: 210,973 (42.7% antlered buck, 57.3% antlerless deer)
- Paid hunting license holders in 2022: 30.2 per 1,000 people (354,606 total)
21. Pennsylvania
- Share of deer harvested with a muzzleloader in 2022: 6% (approx. 25,378 deer)
- Total deer harvested in 2022: 422,960 (38.8% antlered buck, 61.2% antlerless deer)
- Paid hunting license holders in 2022: 75.6 per 1,000 people (981,320 total)
20. Connecticut
- Share of deer harvested with a muzzleloader in 2022: 7% (approx. 731 deer)
- Total deer harvested in 2022: 10,445 (53.6% antlered buck, 46.4% antlerless deer)
- Paid hunting license holders in 2022: 7.9 per 1,000 people (28,670 total)
19. Kentucky
- Share of deer harvested with a muzzleloader in 2022: 7% (approx. 10,115 deer)
- Total deer harvested in 2022: 144,493 (49.2% antlered buck, 50.8% antlerless deer)
- Paid hunting license holders in 2022: 70.7 per 1,000 people (318,869 total)
18. North Carolina
- Share of deer harvested with a muzzleloader in 2022: 8% (approx. 13,106 deer)
- Total deer harvested in 2022: 163,831 (52.6% antlered buck, 47.4% antlerless deer)
- Paid hunting license holders in 2022: 60.8 per 1,000 people (650,361 total)
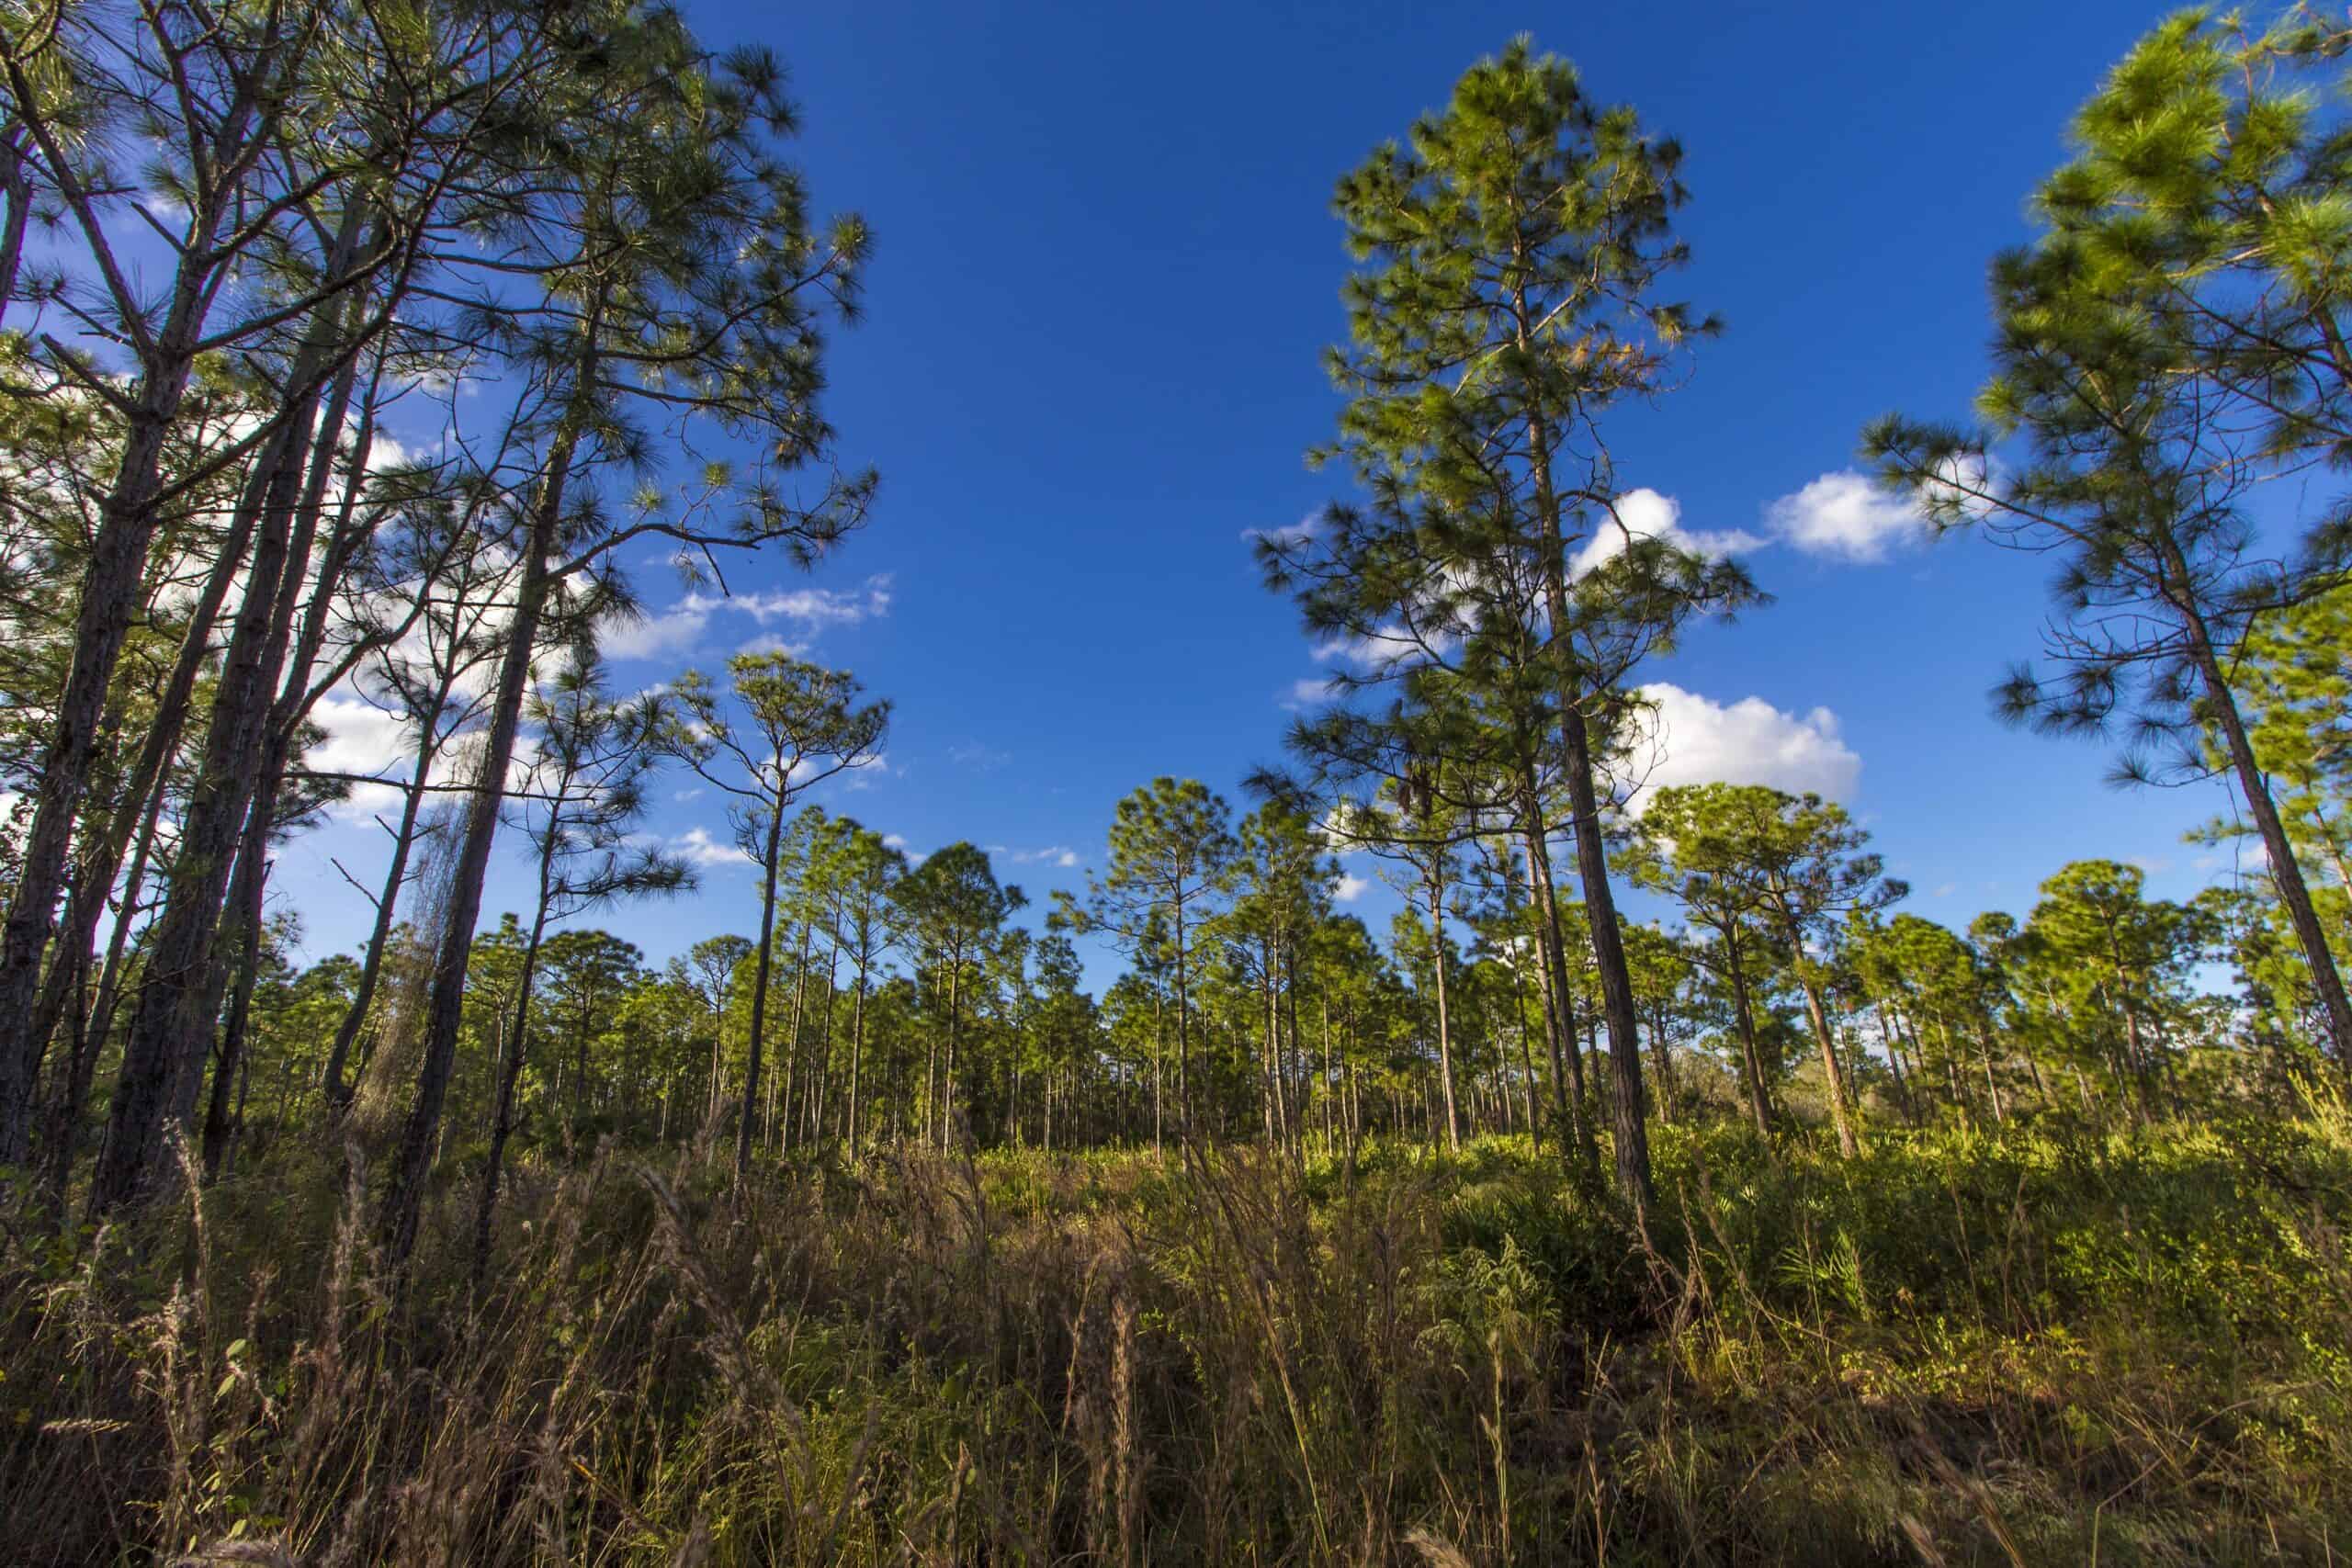
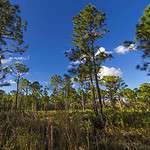
17. Florida
- Share of deer harvested with a muzzleloader in 2022: 9% (approx. 8,414 deer)
- Total deer harvested in 2022: 93,484 (69.5% antlered buck, 30.5% antlerless deer)
- Paid hunting license holders in 2022: 9.8 per 1,000 people (219,074 total)
16. Oklahoma
- Share of deer harvested with a muzzleloader in 2022: 9% (approx. 12,074 deer)
- Total deer harvested in 2022: 134,158 (54.5% antlered buck, 45.5% antlerless deer)
- Paid hunting license holders in 2022: 92.7 per 1,000 people (372,663 total)
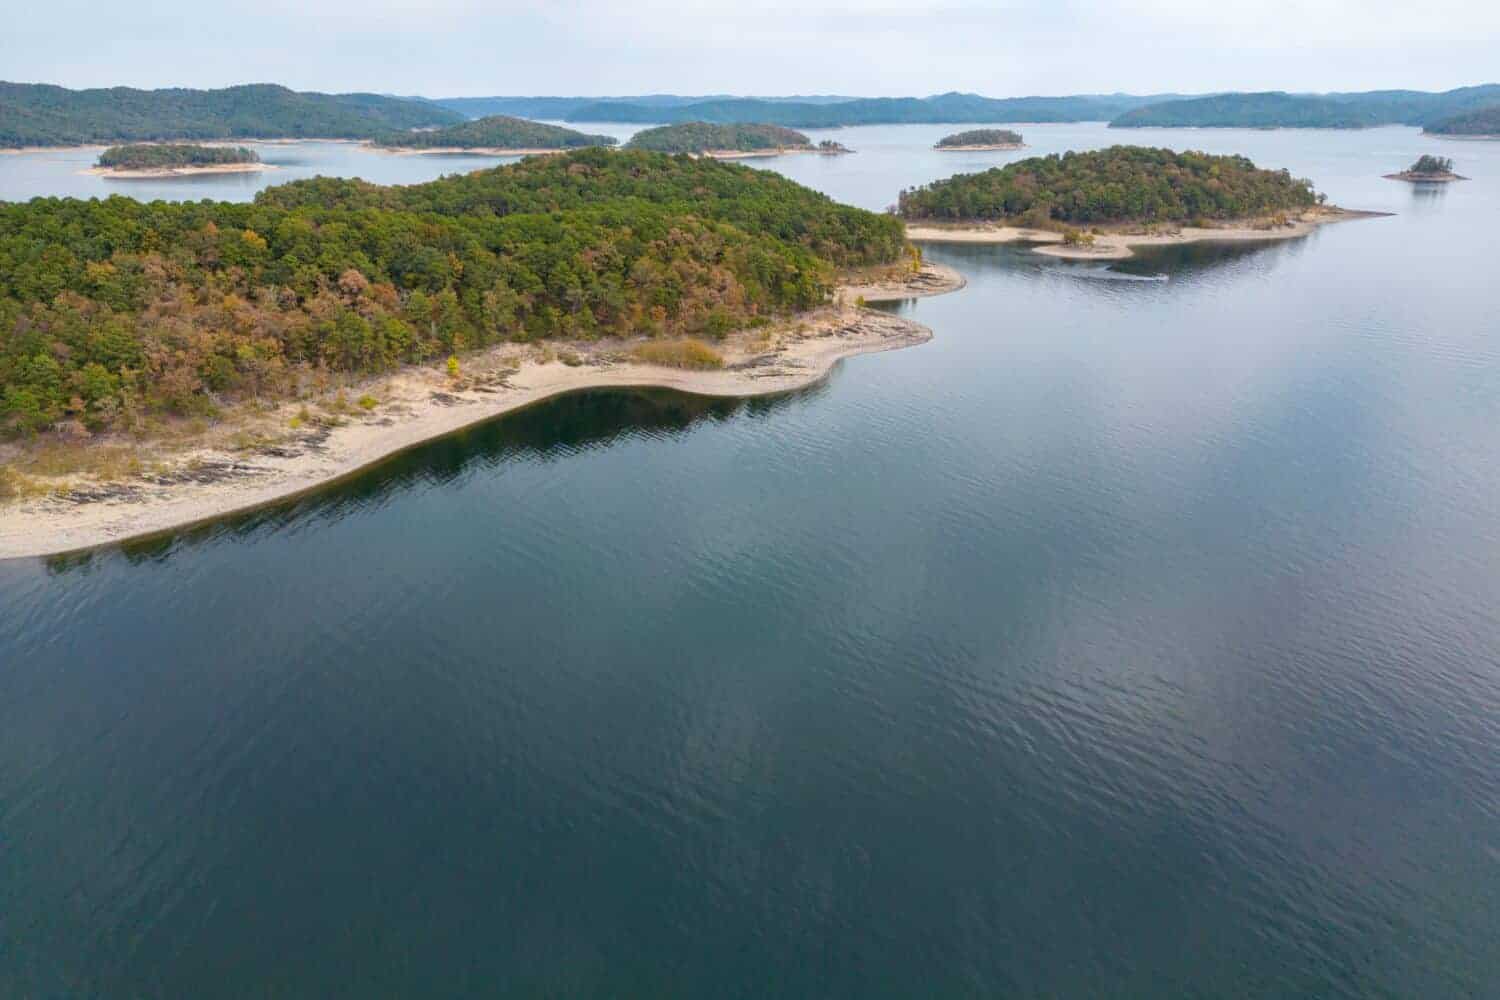
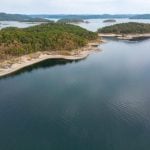
15. Arkansas
- Share of deer harvested with a muzzleloader in 2022: 9% (approx. 16,702 deer)
- Total deer harvested in 2022: 185,579 (48.4% antlered buck, 51.6% antlerless deer)
- Paid hunting license holders in 2022: 114.1 per 1,000 people (347,418 total)
14. New Jersey
- Share of deer harvested with a muzzleloader in 2022: 10% (approx. 3,832 deer)
- Total deer harvested in 2022: 38,324 (42.0% antlered buck, 58.0% antlerless deer)
- Paid hunting license holders in 2022: 7.7 per 1,000 people (70,907 total)
13. Indiana
- Share of deer harvested with a muzzleloader in 2022: 10% (approx. 12,185 deer)
- Total deer harvested in 2022: 121,854 (56.6% antlered buck, 43.4% antlerless deer)
- Paid hunting license holders in 2022: 39.3 per 1,000 people (268,630 total)
12. Delaware
- Share of deer harvested with a muzzleloader in 2022: 11% (approx. 1,853 deer)
- Total deer harvested in 2022: 16,848 (25.9% antlered buck, 74.1% antlerless deer)
- Paid hunting license holders in 2022: 15.7 per 1,000 people (16,034 total)
11. New York
- Share of deer harvested with a muzzleloader in 2022: 11% (approx. 25,516 deer)
- Total deer harvested in 2022: 231,961 (50.2% antlered buck, 49.8% antlerless deer)
- Paid hunting license holders in 2022: 28.1 per 1,000 people (553,475 total)
10. Iowa
- Share of deer harvested with a muzzleloader in 2022: 12% (approx. 13,152 deer)
- Total deer harvested in 2022: 109,600 (42.4% antlered buck, 57.6% antlerless deer)
- Paid hunting license holders in 2022: 68.6 per 1,000 people (219,432 total)
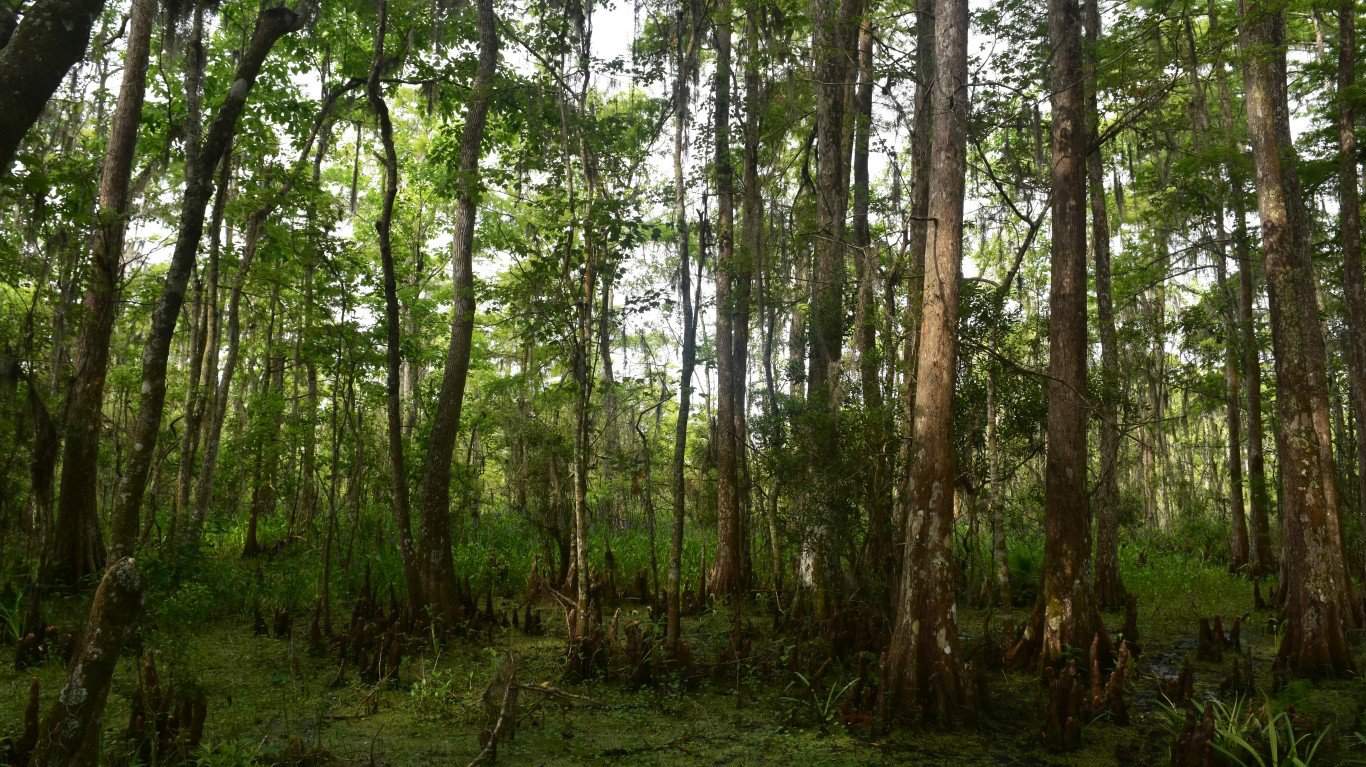
9. Louisiana
- Share of deer harvested with a muzzleloader in 2022: 12% (approx. 26,124 deer)
- Total deer harvested in 2022: 217,700 (55.5% antlered buck, 44.5% antlerless deer)
- Paid hunting license holders in 2022: 94.4 per 1,000 people (433,219 total)
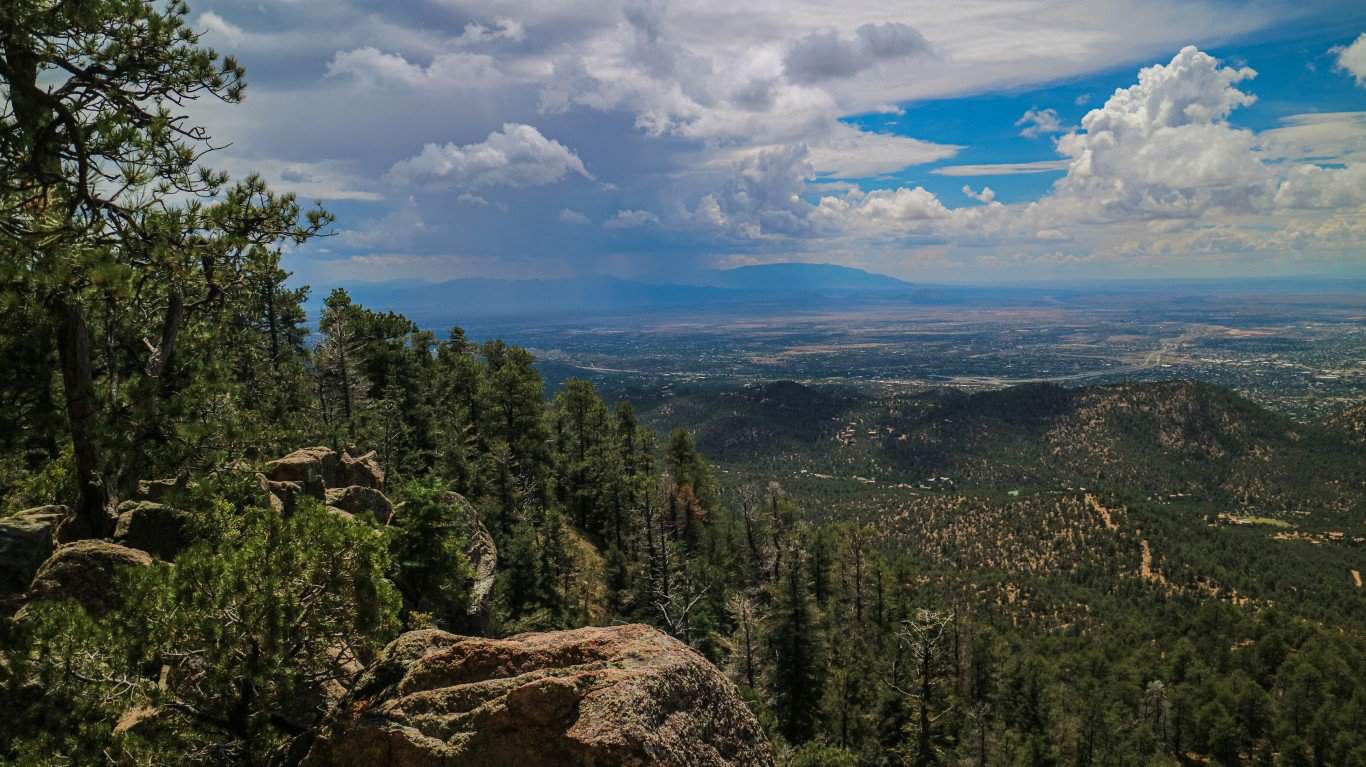
8. New Mexico
- Share of deer harvested with a muzzleloader in 2022: 13% (approx. 1,205 deer)
- Total deer harvested in 2022: 9,266 (98.1% antlered buck, 1.9% antlerless deer)
- Paid hunting license holders in 2022: 75.9 per 1,000 people (160,322 total)
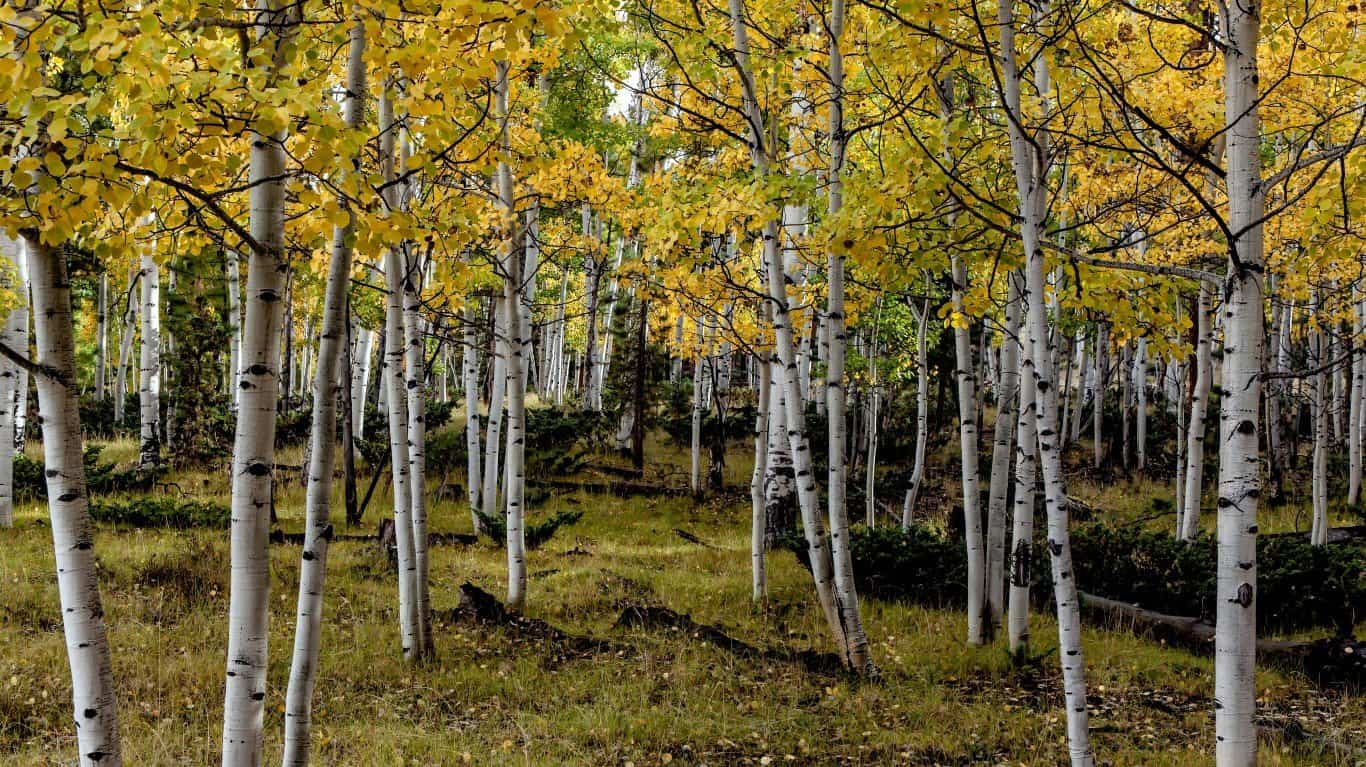
7. Utah
- Share of deer harvested with a muzzleloader in 2022: 15% (approx. 4,130 deer)
- Total deer harvested in 2022: 27,536 (92.9% antlered buck, 7.1% antlerless deer)
- Paid hunting license holders in 2022: 79.0 per 1,000 people (267,238 total)
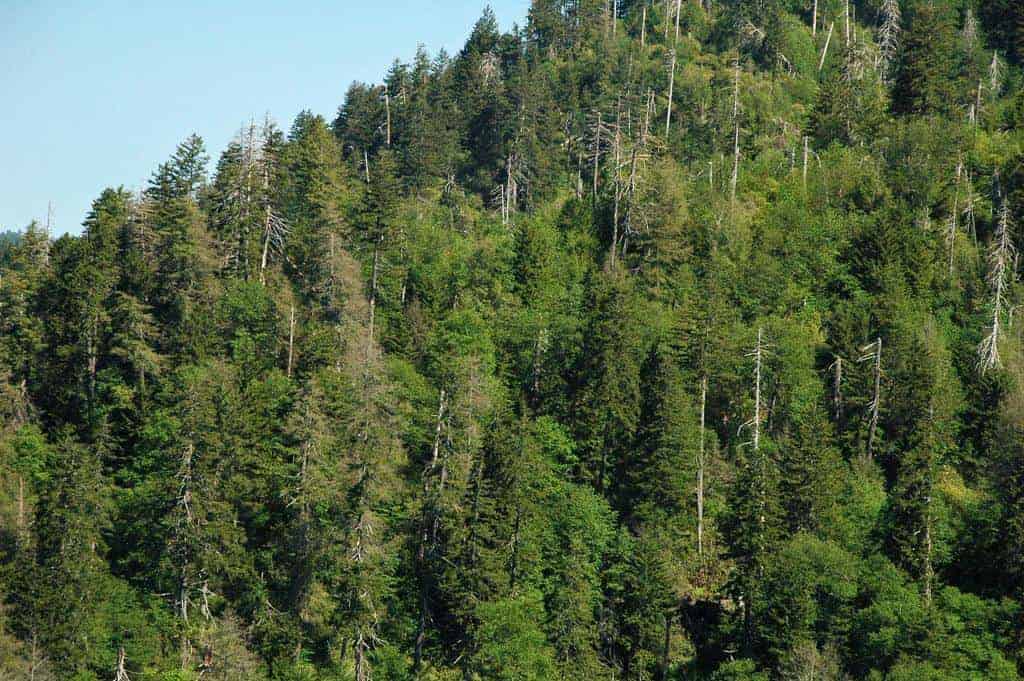
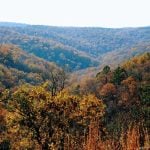
6. Tennessee
- Share of deer harvested with a muzzleloader in 2022: 15% (approx. 24,487 deer)
- Total deer harvested in 2022: 163,244 (52.9% antlered buck, 47.1% antlerless deer)
- Paid hunting license holders in 2022: 119.7 per 1,000 people (844,172 total)
5. New Hampshire
- Share of deer harvested with a muzzleloader in 2022: 18% (approx. 2,535 deer)
- Total deer harvested in 2022: 14,082 (59.2% antlered buck, 40.8% antlerless deer)
- Paid hunting license holders in 2022: 43.2 per 1,000 people (60,323 total)
4. Vermont
- Share of deer harvested with a muzzleloader in 2022: 18% (approx. 3,143 deer)
- Total deer harvested in 2022: 17,461 (55.1% antlered buck, 44.9% antlerless deer)
- Paid hunting license holders in 2022: 93.8 per 1,000 people (60,719 total)
3. Massachusetts
- Share of deer harvested with a muzzleloader in 2022: 23% (approx. 3,646 deer)
- Total deer harvested in 2022: 15,853 (57.3% antlered buck, 42.7% antlerless deer)
- Paid hunting license holders in 2022: 8.9 per 1,000 people (61,865 total)
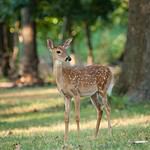
2. Virginia
- Share of deer harvested with a muzzleloader in 2022: 24% (approx. 44,829 deer)
- Total deer harvested in 2022: 186,788 (49.0% antlered buck, 51.0% antlerless deer)
- Paid hunting license holders in 2022: 28.7 per 1,000 people (248,951 total)
1. Rhode Island
- Share of deer harvested with a muzzleloader in 2022: 42% (approx. 1,136 deer)
- Total deer harvested in 2022: 2,705 (48.1% antlered buck, 51.9% antlerless deer)
- Paid hunting license holders in 2022: 7.4 per 1,000 people (8,099 total)