© l i g h t p o e t/Shutterstock.com
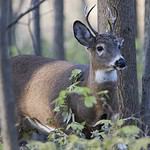
© Tom Reichner / Shutterstock.com
© OUTDOOR_MEDIA/Shutterstock.com
© paul geilfuss/Shutterstock.com
© Stefan Malloch/ via Getty Images
© Neil Podoll/Shutterstock.com
© James St. John / CC BY 2.0 / Flickr
© Danita Delimont / Shutterstock.com
© Cheri Alguire / iStock via Getty Images
© Wirestock / iStock via Getty Images
© Wing-Chi Poon / CC BY-SA 3.0 / Wikimedia Commons
© DejaVu Designs / iStock via Getty Images
© jariceiii / Flickr
© pavdw / Flickr
© marekuliasz / iStock via Getty Images
© KenCanning / E+ via Getty Images
© James St. John / CC BY 2.0 / Flickr
© My Public Lands Roadtrip: Pine Forest Range Wilderness Area in Nevada by mypubliclands / BY 2.0 (https://creativecommons.org/licenses/by/2.0/)
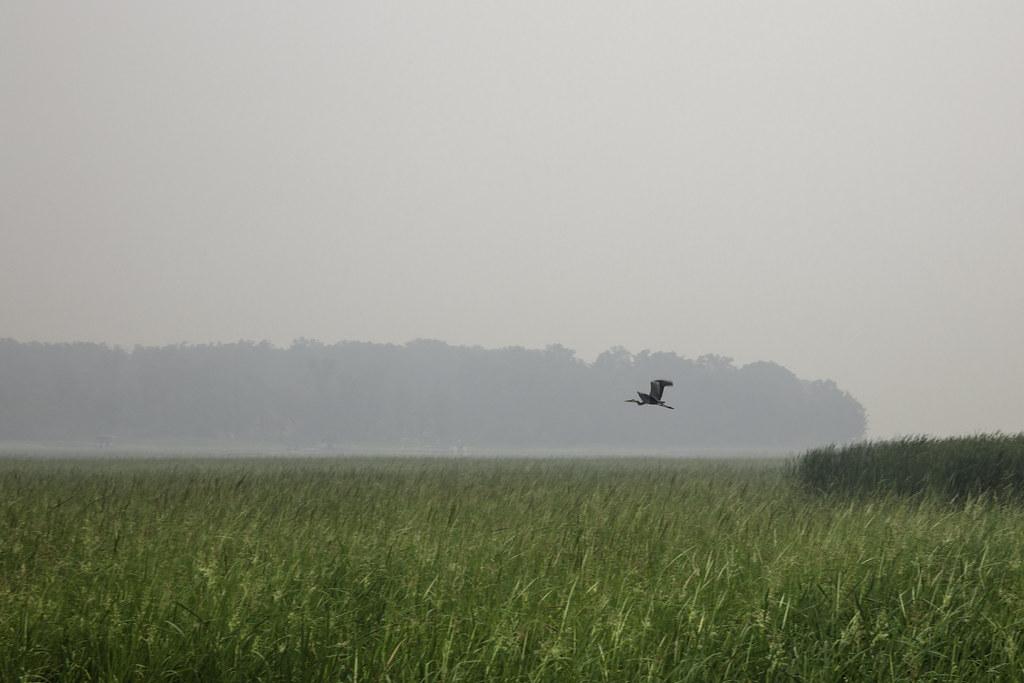
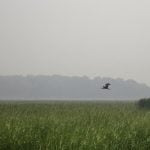
© A Great Blue Heron at Big Sandy Lake in McGregor Minnesota with smoke haze from forest fires in Canada by Lorie Shaull / BY 2.0 (https://creativecommons.org/licenses/by/2.0/)
© Bureau of Land Management / CC BY 2.0 / Flickr
© Laurie Drake / iStock via Getty Images
© amanderson2 / CC BY 2.0 / Flickr
© mirceax / iStock via Getty Images
© jerry7171 / Flickr
© Boris Kuznetsov / CC BY 2.0 / Flickr
© zrfphoto / iStock via Getty Images
© Michael Treglia / iStock via Getty Images
© wangjs / Flickr
© Sean Pavone / iStock via Getty Images
© corradobarattaphotos / iStock via Getty Images
© sdbower / iStock via Getty Images
© Richard Wood / iStock via Getty Images
© PapaBear / iStock via Getty Images
© Christina Gray / Moment via Getty Images

© Jon Bilous / iStock via Getty Images
© wackybadger / Flickr
© Paul Massie Photography / iStock via Getty Images
© kenlund / Flickr
© kanonsky / iStock via Getty Images
© KenCanning / E+ via Getty Images
© Harry Collins / iStock via Getty Images

© corradobarattaphotos / iStock via Getty Images
© ricardoreitmeyer / iStock via Getty Images

© Pjard / iStock via Getty Images
© Purdue9394 / iStock via Getty Images

© joiseyshowaa / Flickr
© Jennifer Yakey-Ault / iStock via Getty Images
© Forest Near Boardwalk from Brandywine Falls, Cuyahoga Valley National Park, Ohio by Ken Lund / BY-SA 2.0 (https://creativecommons.org/licenses/by-sa/2.0/)
© luvemakphoto / iStock via Getty Images