
© Francesco Scatena/Shutterstock.com

© Sean Pavone/Shutterstock.com

© gguy44/iStock via Getty Images

© f11photo/Shutterstock.com

© Peterfitzgerald / This picture is not protected by copyright. The original creator released it into the public domain and has released all rights. This applies worldwide.

© AndreyKrav/iStock via Getty Images

© marekuliasz/Shutterstock.com

© Alexander Lukatskiy/Shutterstock.com

© Michael Kaercher/Shutterstock.com

© iStock.com/pabradyphoto

© Janece Flippo/Shutterstock.com

© BestStockFoto/Shutterstock.com

© Michele M Vogel/Shutterstock.com

© rzdeb/iStock via Getty Images

© Joseph Sohm/Shutterstock.com

© LesPalenik/Shutterstock.com

© Tudoran Andrei/Shutterstock.com

© Joseph Sohm/Shutterstock.com

© Kirk Fisher/Shutterstock.com

© AndreyKrav/Shutterstock.com

© Leo_nik/Shutterstock.com

© iStock.com/smodj

© Joseph Sohm/Shutterstock.com

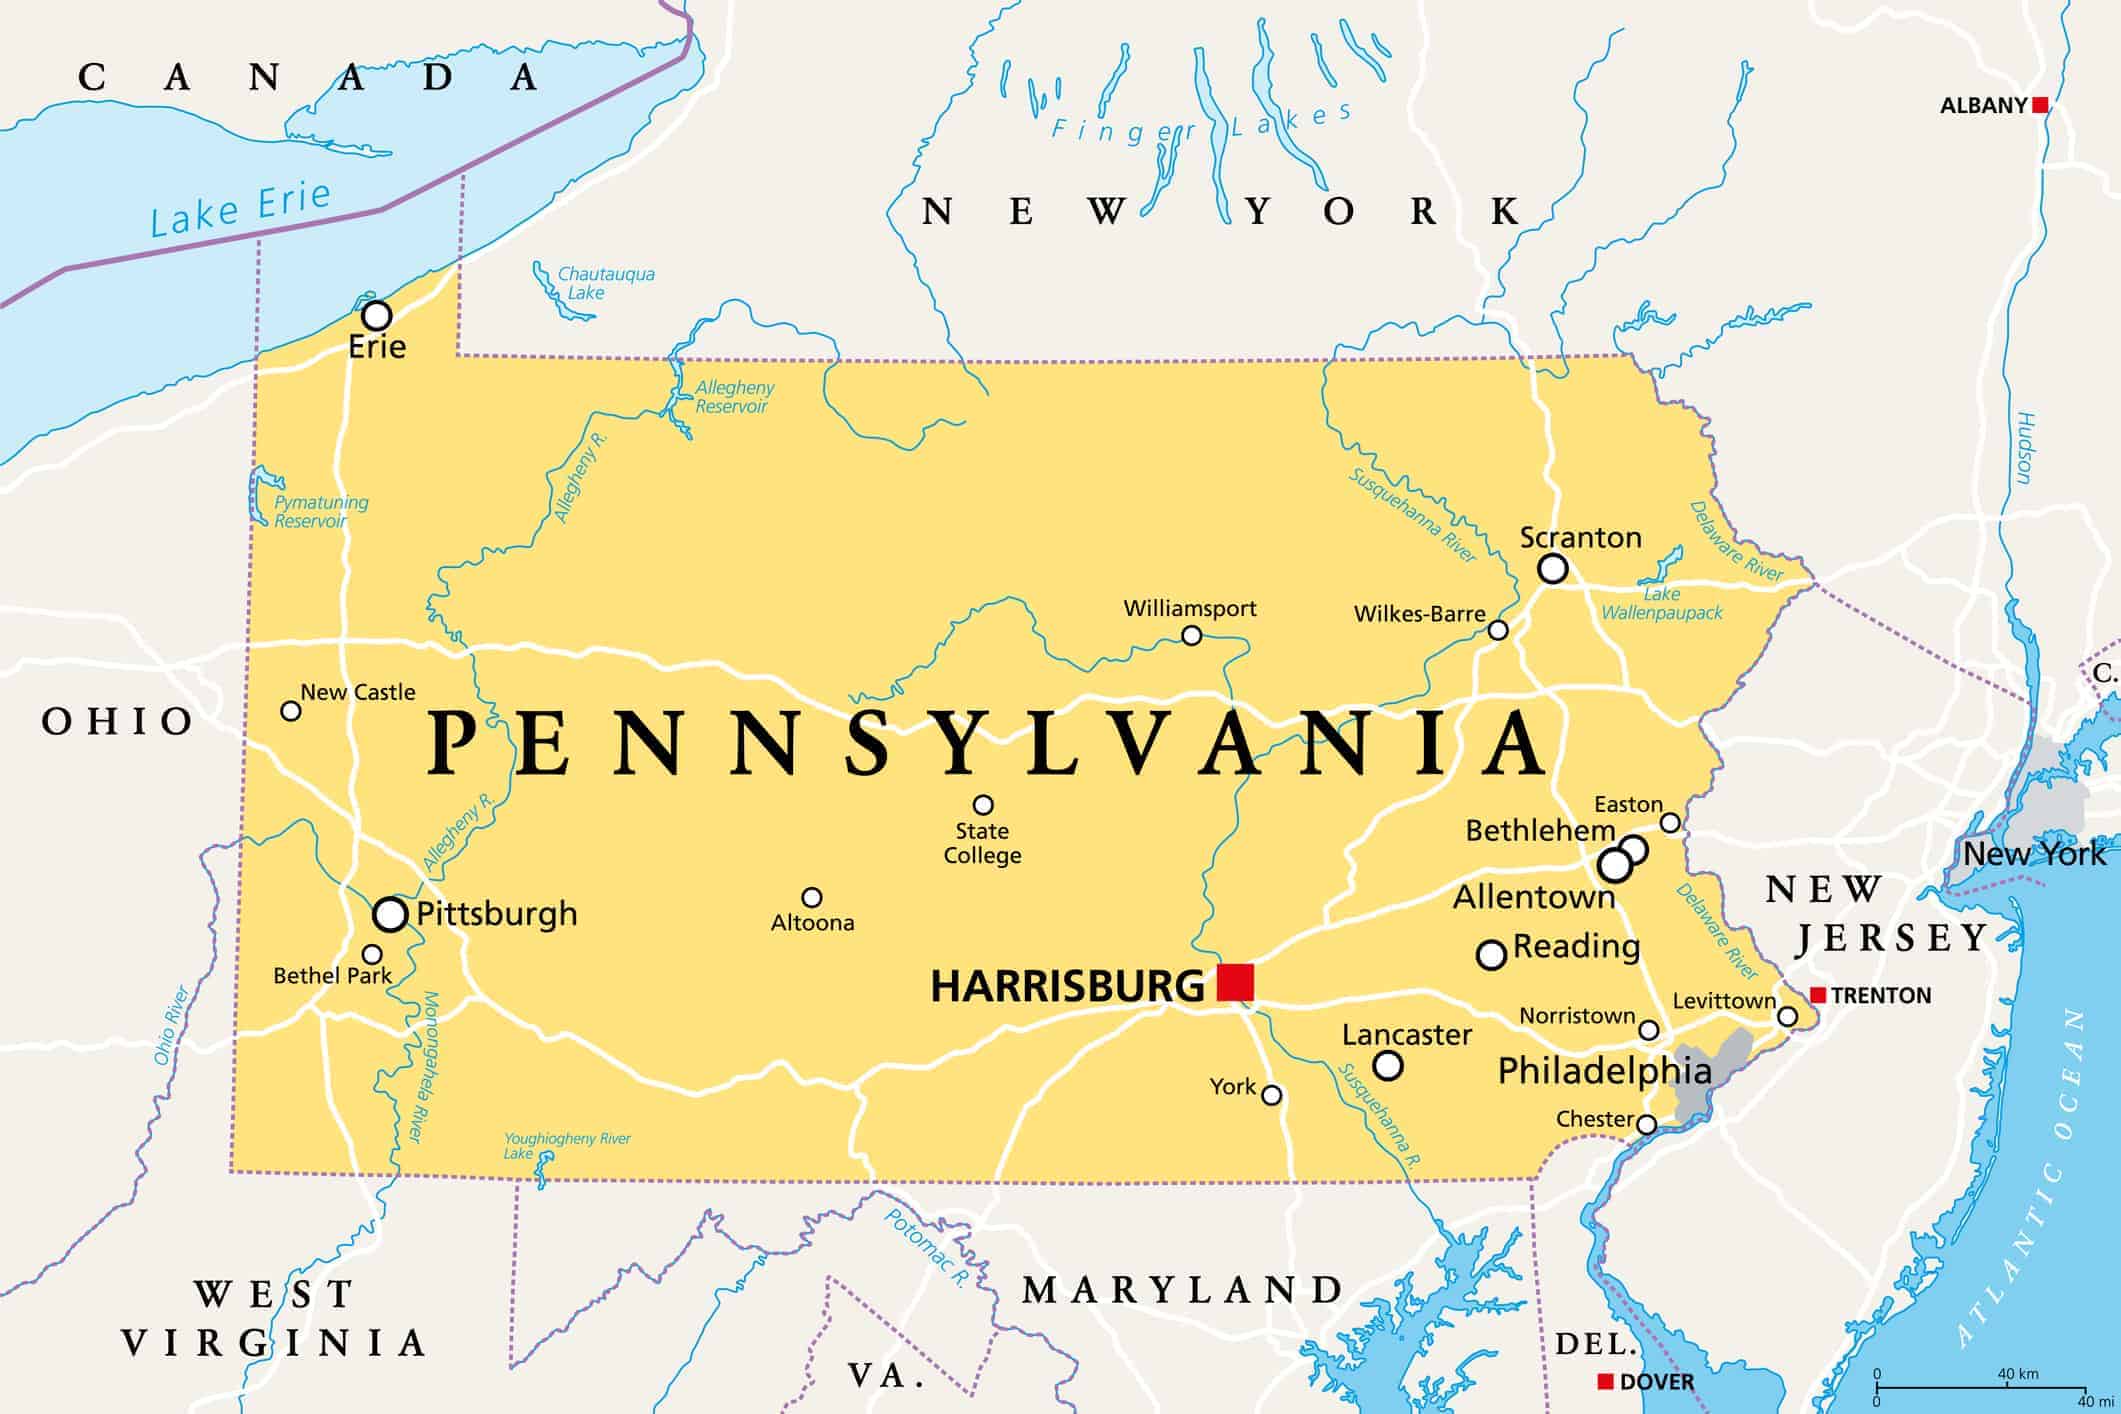
© PeterHermesFurian/iStock via Getty Images

© Ingo70/Shutterstock.com

© Ingo70/Shutterstock.com


States with the Highest Levels of Radioactive Radon Gas
When it comes to things to worry about in your daily life, radioactive radon gas probably isn’t at the top of your list. However, using data compiled by Data Pandas, we can see which states have the highest radioactive (pCi/L) levels in the U.S. Without smell, color, or taste, radon can be very dangerous, and the Environmental Protection Agency recommends taking action to reduce the levels.
To produce its findings, Data Pandas collated data from all 50 states. They ranked each state based on the average amount of radon in “picocuries per liter (pCi/L),” the traditional way to measure radioactivity. With this in mind, let’s see which states rank the highest and require immediate action to reduce radon levels as soon as possible.
25. Utah
- pCi/L level: 4.4
24. New Jersey
- pCi/L level: 4.4
23. Minnesota
- pCi/L level: 4.6
22. Indiana
- pCi/L level: 4.7
21. Tennessee
- pCi/L level: 4.8
20. Kansas
- pCi/L level: 4.9
19. Wyoming
- pCi/L level: 5.0
18. Nebraska
- pCi/L level: 5.2
17. Illinois
- pCi/L level: 5.3
16. Maryland
- pCi/L level: 5.4
15. New Hampshire
- pCi/L level: 5.6
14. Wisconsin
- pCi/L level: 5.7
13. Maine
- pCi/L level: 5.9
12. North Dakota
- pCi/L level: 6.0
11. West Virginia
- pCi/L level: 6.1
10. Iowa
- pCi/L level: 6.1
9. Colorado
- pCi/L level: 6.8
8. Idaho
- pCi/L level: 7.3
7. Kentucky
- pCi/L level: 7.4
6. Montana
- pCi/L level: 7.4
5. Washington
- pCi/L level: 7.4
4. Ohio
- pCi/L level: 7.8
3. Pennsylvania
- pCi/L level: 8.6
2. South Dakota
- pCi/L level: 9.6
1. Alaska
- pCi/L level: 10.7